Mastering Instruments (Part 3): Scientific Method, Advanced Time Profiler, and Profiling at Scale
Learn to diagnose performance issues as a scientific process. Master Weight vs Self-Weight, Charge/Prune/Flatten, and scale profiling with xctrace.
In Part 1 we learned to use Instruments as technicians — buttons, templates, filters. In Part 2 we became doctors — studying the anatomy of memory and binaries. In Part 2.5 we saw that anatomy in action — malloc reserving blocks, ARC counting references, retain cycles trapping memory.
Today we take on the most demanding role: the pathologist. The pathologist doesn’t guess. They observe evidence, form a hypothesis, design an experiment, and let the data confirm or refute the theory. That’s exactly what we’re going to do with our app’s performance.
A good diagnosis doesn’t start with the tool. It starts with the right question.
The Scientific Method of Performance Debugging
Imagine a doctor who, without examining the patient, says: “It’s probably the heart. Let’s operate.” Sounds absurd, right? But in software development we do this constantly. “The app is slow — it’s definitely the JSON.” “The scroll stutters — must be the image downloads.” And we spend hours optimizing the wrong part of the code.
The alternative is to treat performance debugging for what it is: a scientific process.
The 5 Steps
-
Observe — Describe the symptom precisely. Not “the app is slow.” Better: “scrolling drops below 30fps after loading more than 500 cells in
PersonTableViewController.” -
Form a hypothesis — Based on your knowledge of the code, propose a specific, testable cause. Example: “I suspect
PeopleStore.peopleis decoding the JSON on every cell access.” -
Design the experiment — Choose the right instrument. If you suspect CPU, use Time Profiler. If you suspect memory, Allocations. Define what you’ll measure and under what conditions.
-
Measure — Run the profile. Resist the temptation to look at the source code before seeing the data. Let Instruments speak first.
-
Interpret and iterate — Do the data confirm your hypothesis? Great, now you have a clear direction. Do they refute it? Even better — you just saved yourself hours of wasted work. Form a new hypothesis and repeat.
- Date / Build / Device: iPhone 15 Pro, iOS 18.2, build #47, Release
- Observed symptom: Scroll drops below 30fps when displaying the people table
- Hypothesis: PeopleStore.people decodes JSON on every cell access
- Instrument chosen: Time Profiler
- Result: Confirmed — JSONDecoder.decode appears 847 times in 5 seconds
- Next step: Cache the decoding result in a lazy property
Time Profiler Anatomy
We already used Time Profiler in Part 1 to diagnose the SuperStuff problem. But do we really understand how it works? Because Time Profiler doesn’t record every nanosecond of execution. It uses sampling.
How sampling works
By default, Time Profiler fires a timer approximately 1,000 times per second — one sample per millisecond. On each sample, it captures the complete stack trace of every active thread: which function is executing, who called it, who called that one, and so on up to main().
This means Time Profiler is statistical, not exact. A function that executes for 0.5 milliseconds between two samples might never appear. But this isn’t a limitation — it’s a feature. Functions that appear in more samples are the ones consuming more time proportionally. And proportions are what matter for optimization.
Weight vs Self-Weight: the manager and the worker
These two columns in the Call Tree are the key to understanding where the problem really is.
Weight is the total time a function appears in sampled stacks — including the time of all functions it calls. If cellForRowAt appears in 850 samples, its Weight is 850ms. But that doesn’t mean cellForRowAt itself is slow — it may simply be the “gateway” to slower functions deeper down.
Self-Weight is the time that specific function was at the top of the stack — meaning it was the function actually executing when the sample was taken. If cellForRowAt has a Self-Weight of 5ms, it means only 5 of those 850 samples caught cellForRowAt doing its own work. The other 845 samples found it waiting for deeper functions to finish.
Weight tells you who started the work. Self-Weight tells you who did it. The difference between the two is the difference between the manager and the worker.
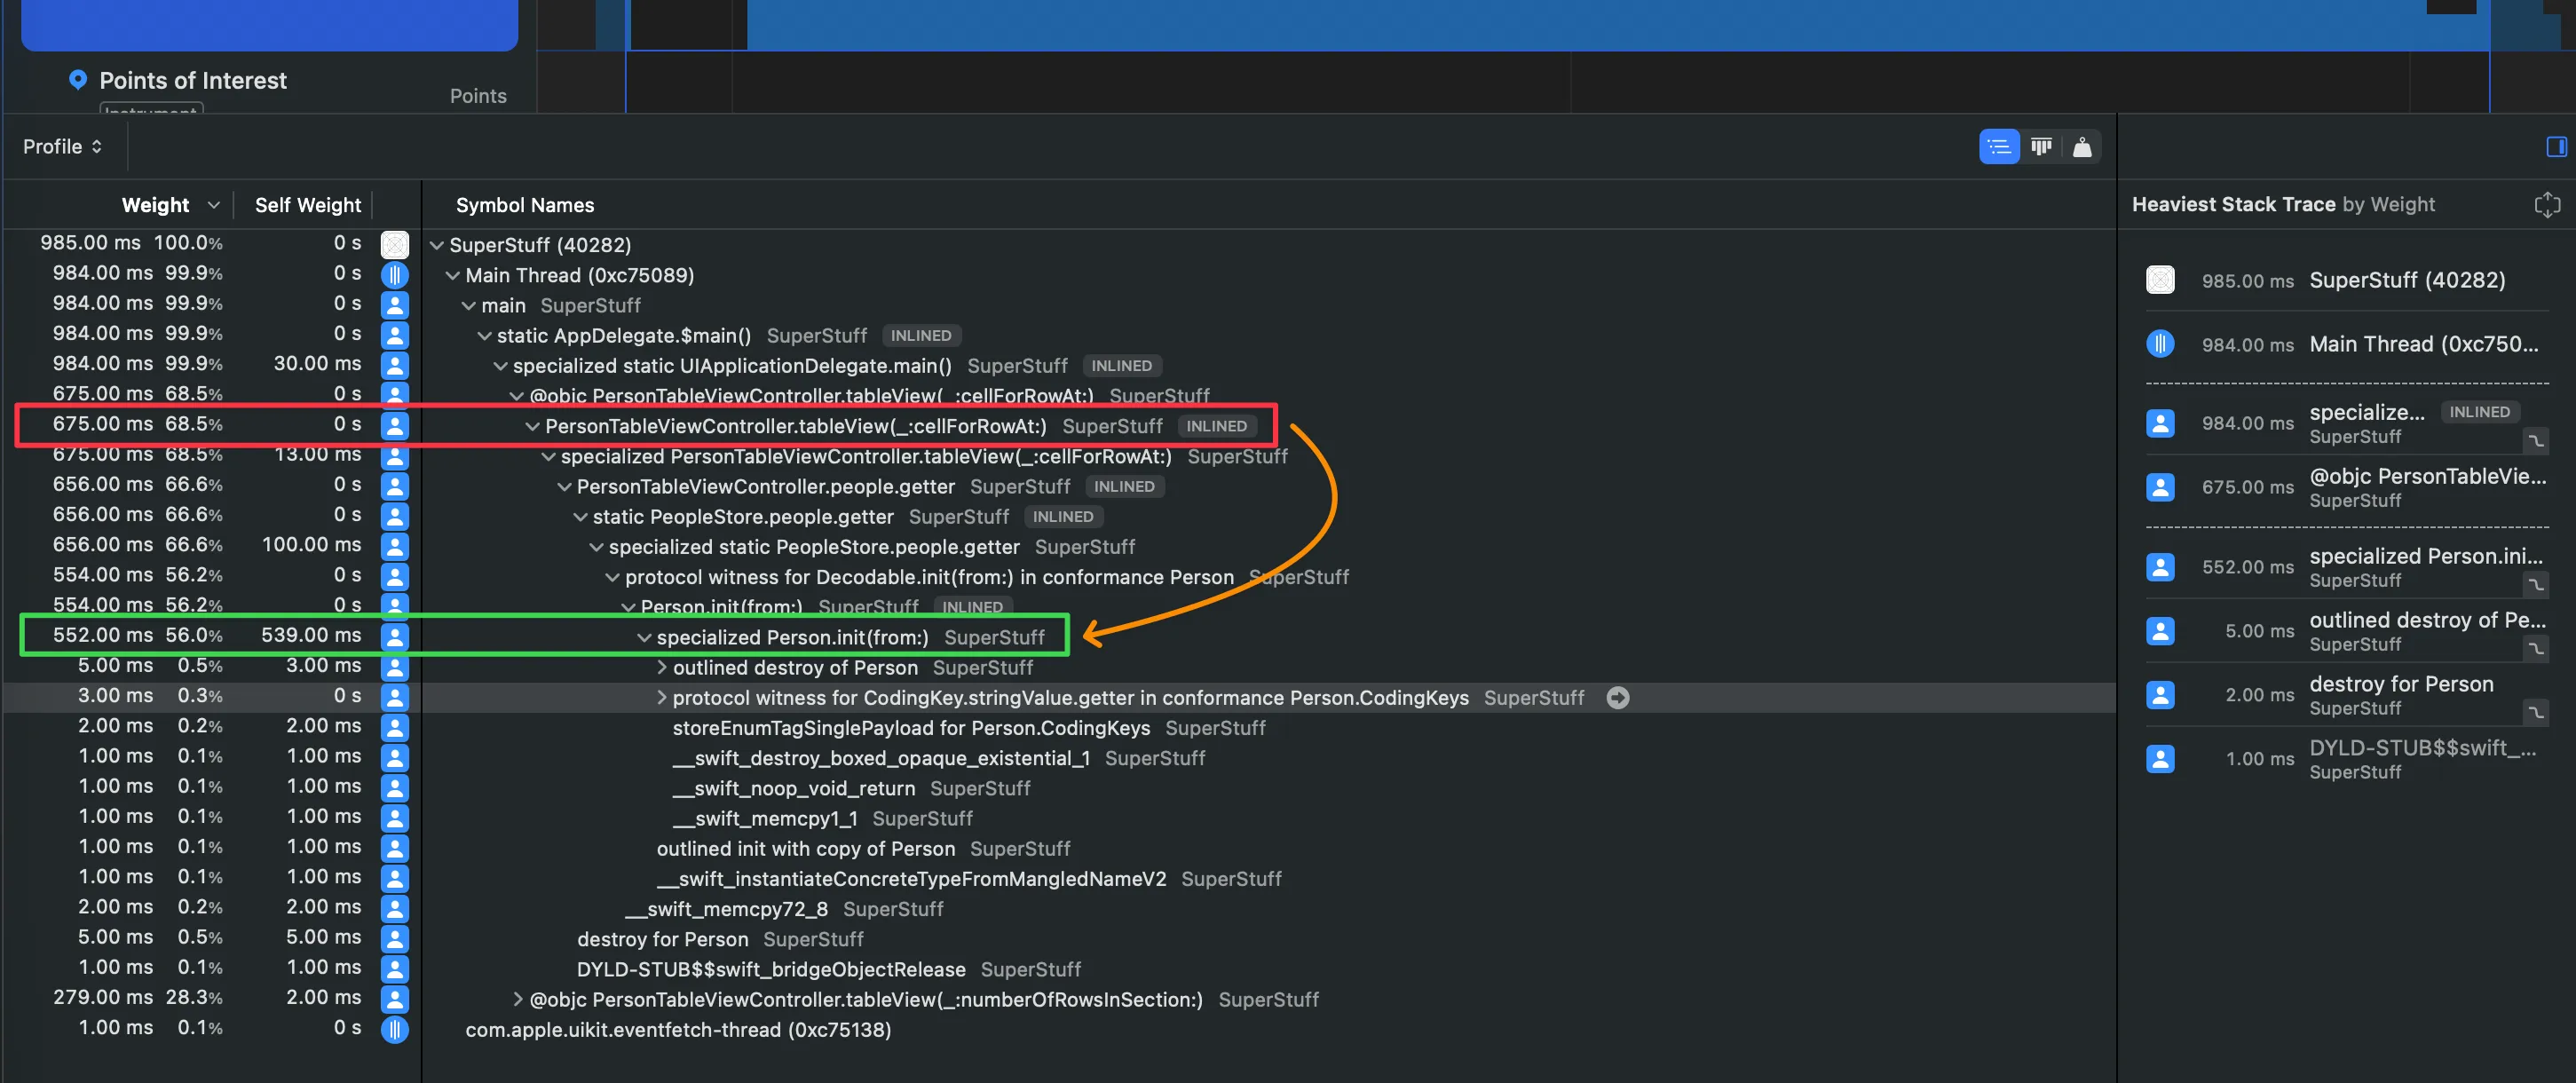
- Weight = total time the function appears in any sampled stack (includes descendants)
- Self-Weight = time the function is at the TOP of the stack (its own work)
- High Weight + High Self = leaf function doing heavy work. Direct optimization candidate
- High Weight + Low Self = coordinator calling expensive functions. Keep drilling down
- Low Weight = not a significant contributor to the problem
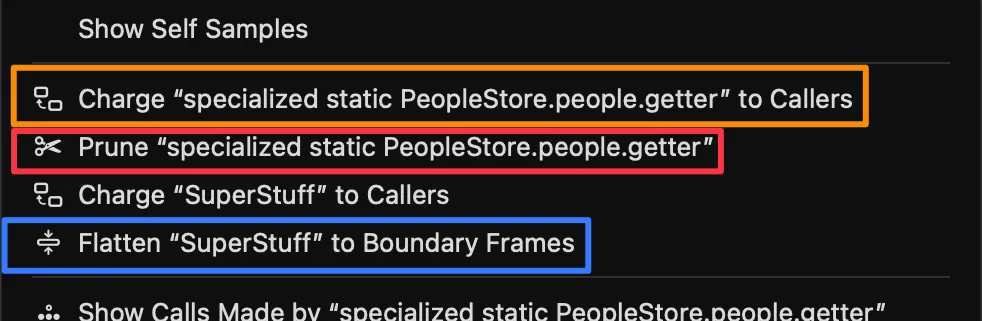
Data Surgery: Charge, Prune, and Flatten
Filtering with “Hide System Libraries” is a great first step, but sometimes it’s not enough. Your Call Tree is still full of intermediate functions, framework wrappers, and protocol witness thunks that add noise without adding insight. Instruments offers three precision operations to manipulate the call tree.
Flatten
What does it do? Removes a function from the tree and moves its children directly to the parent. It’s like removing a link from a chain — the adjacent links connect directly.
When to use it? When an intermediate function is just a “bridge” that adds no information. Protocol witness thunks, generic wrappers, or functions with Self-Weight near 0 are perfect candidates.
Prune
What does it do? Removes a function and all its descendants from the analysis. The entire time of that branch disappears.
When to use it? When you’ve identified a subtree you know is irrelevant to your investigation. If you’re chasing a CPU problem and the analytics SDK shows up with 50ms, you can prune it to clean up the noise.
Charge
What does it do? Collapses all children of a function, absorbing their time. The function’s Self-Weight becomes equal to its Weight — it becomes a black box.
When to use it? When you already know an operation is expensive and want to see its total consolidated cost to compare it with other branches of the tree.
- Flatten → Removes the function, moves children to parent. No time lost. For noisy intermediaries.
- Prune → Removes the function AND its children. Time disappears. For irrelevant branches.
- Charge → Collapses children into the function. Self = Weight. To see total cost as a black box.
- How to access: Right-click any function in the Instruments Call Tree.
Reading about these operations isn’t the same as seeing them in action. Use the interactive component below to experiment with each one on a Call Tree based on real SuperStuff data:
Call Tree Surgery
Experiment with Flatten, Prune, and Charge on a real SuperStuff Call Tree.
Removes an intermediate function and moves its children to the parent.
From Time Profiler to Processor Trace
Not all time instruments are created equal. Think of them as three magnification levels on a microscope — each reveals more detail, but at a higher cost.
Level 1: Time Profiler (timer-based)
This is what we’ve been using. A timer fires ~1,000 times per second and captures the stack trace. It’s lightweight (~5% overhead), works on any Apple hardware, and is perfect as a starting point. The vast majority of performance issues can be diagnosed here.
Its limitation: being statistical, it can miss very short functions that execute between two samples.
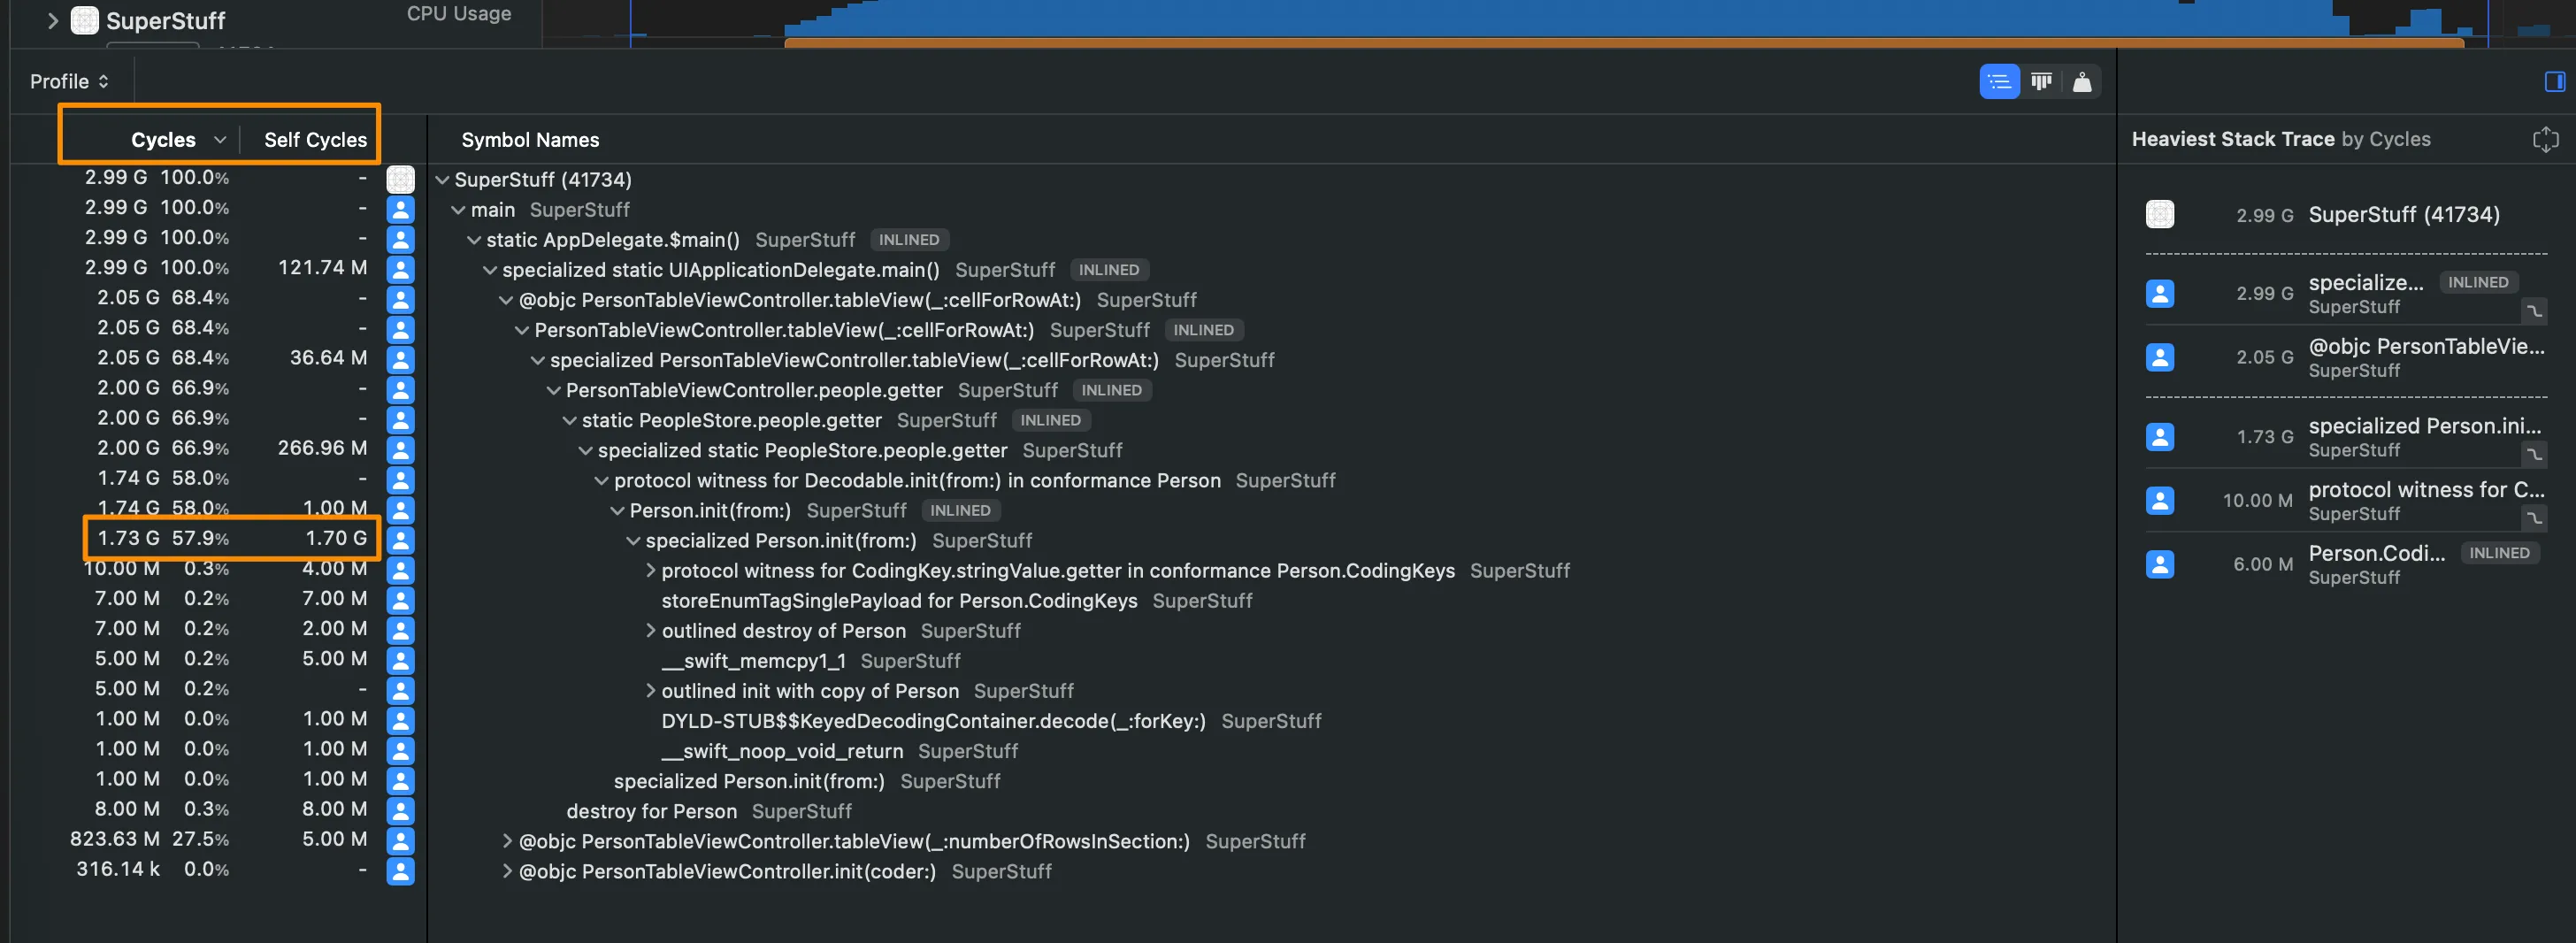
Level 2: CPU Profiler (hardware counter-based)
Instead of a timer, CPU Profiler uses the processor’s Performance Monitoring Counters (PMCs) — hardware counters that measure actual clock cycles. This means samples are distributed based on how much real work each core does, not based on wall clock time.
In practice, this gives you units in cycles instead of milliseconds, which more faithfully reflects the real cost of code on the hardware. Available on all Apple Silicon.
Level 3: Processor Trace (instruction-level recording)
The ultimate level. Processor Trace doesn’t sample — it records absolutely every instruction executed by every core. Nothing escapes. Where Time Profiler gives you 1,400 samples in one second, Processor Trace can give you 117 million records in the same interval.
It requires modern hardware (M4 or A18 and later) and, surprisingly, generates only about ~1% overhead according to Apple. However, it produces massive data volumes (gigabytes per second in multi-threaded apps), so it’s designed for short, highly targeted recordings. Perfect for answering: “did this function execute at all?” or “what exact path did execution take inside this framework?”
Time Profiler tells you where your app spends its time. CPU Profiler tells you where it spends its cycles. Processor Trace tells you exactly what happened — every instruction, every branch, every call.
- Time Profiler → Timer ~1kHz | ~5% overhead | Statistical | All Apple hardware
- CPU Profiler → PMC counters | ~5-10% overhead | Statistical (cycle-accurate) | Apple Silicon
- Processor Trace → Every instruction | ~1% overhead (but generates GBs of data) | Deterministic | M4/A18+ only
- Recommendation: Always start with Time Profiler. Scale up only when you need more precision.
CI Profiling with xctrace
Everything we’ve done so far has been interactive — open Instruments, record manually, analyze with your eyes. But performance problems don’t always happen while you’re watching. You need automation.
xctrace is the command-line tool that lives behind Instruments. Everything you can do in the GUI, you can script.
Recording a trace from Terminal
# Record a 10-second Time Profiler tracexctrace record --template "Time Profiler" \ --output ./traces/perf_$(date +%Y%m%d).trace \ --time-limit 10s \ --attach "SuperStuff"Exporting data for automated analysis
# Export trace data as XMLxctrace export --input ./traces/perf_20260514.trace \ --xpath '/trace-toc/run/data/table[@schema="time-profile"]'Integration with performance tests
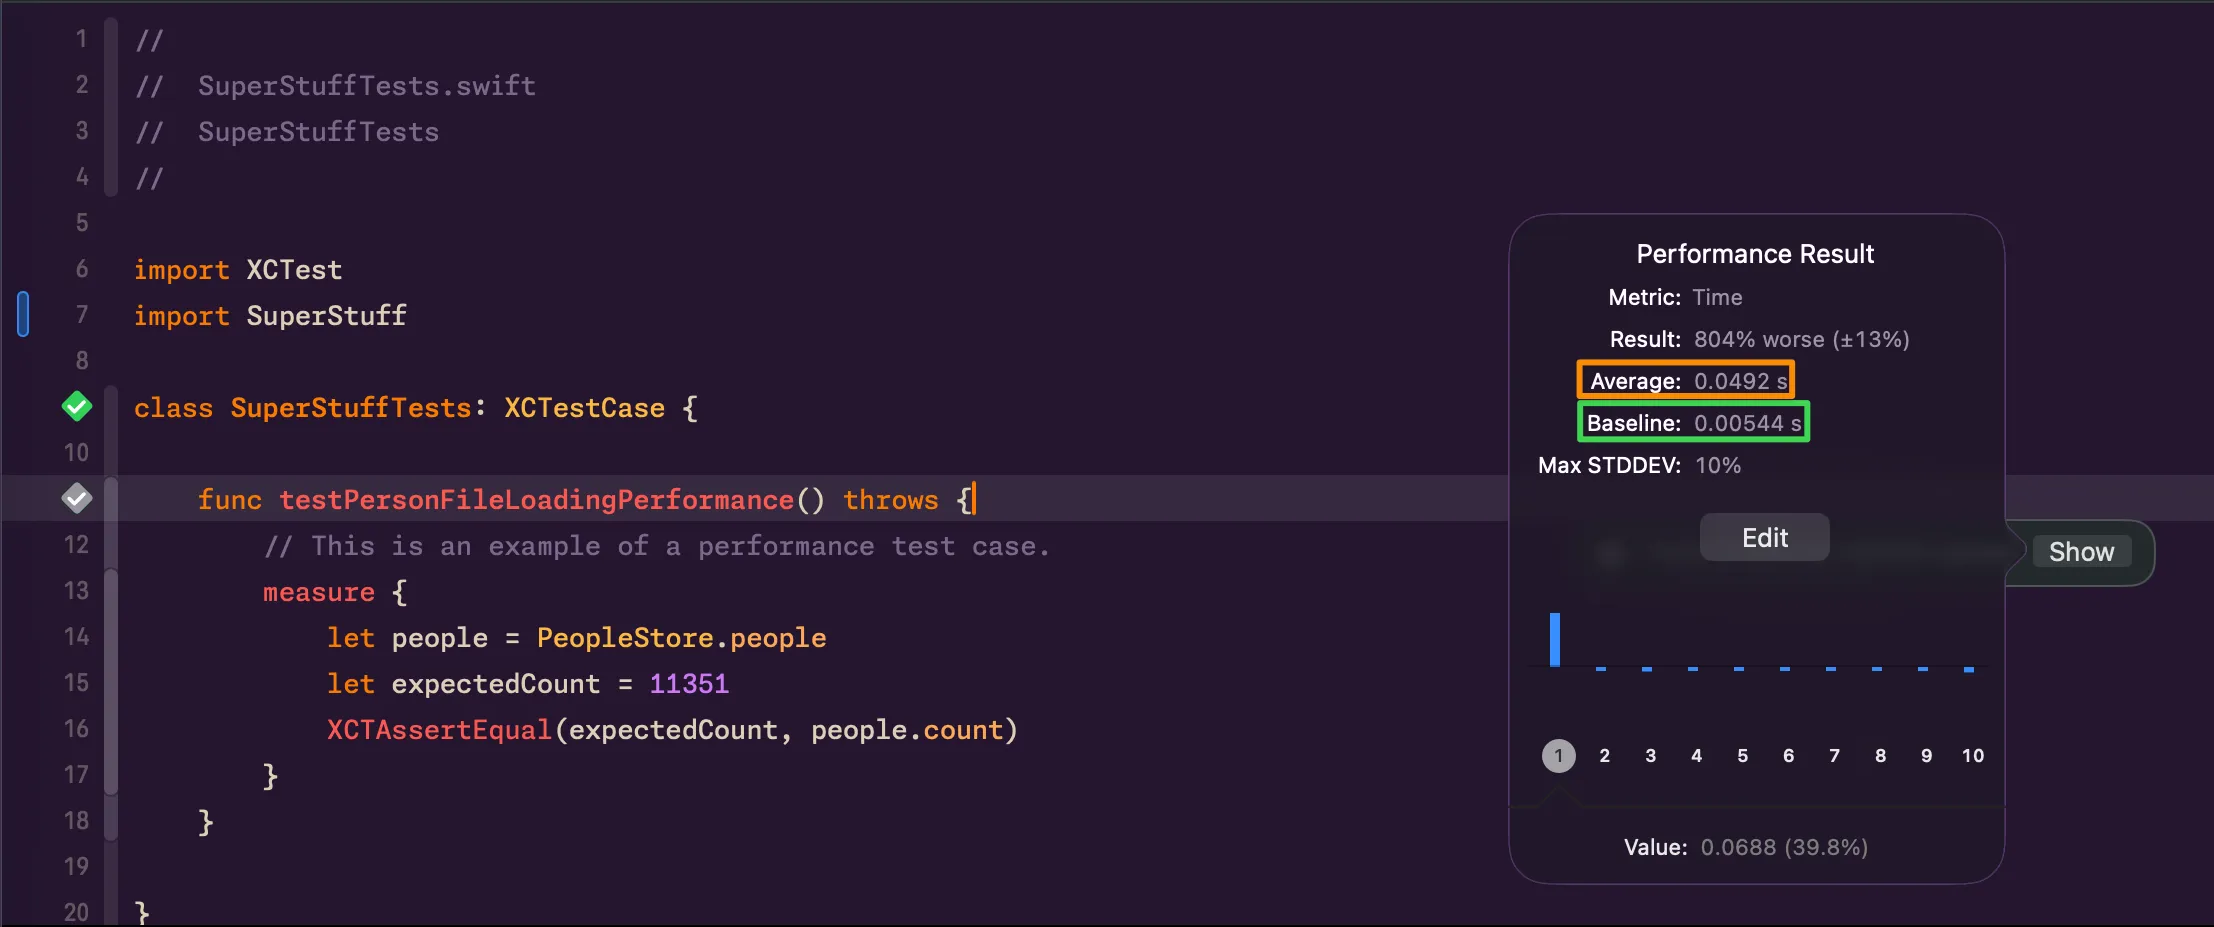
Remember the testPersonFileLoadingPerformance test from SuperStuff?
func testPersonFileLoadingPerformance() throws { measure { let people = PeopleStore.people XCTAssertEqual(11351, people.count) }}The measure { } block runs the code multiple times, calculates the average, and compares it against a baseline you define in Xcode. If the average exceeds the baseline by a configurable margin, the test fails. In CI, this becomes your safety net against performance regressions.
xctrace record→ Record a new trace (requires —template and —output)xctrace export→ Export data from an existing tracexctrace list devices→ List available devicesxctrace list templates→ List available Instruments templatesxctrace list instruments→ List individual instruments availableman xctrace→ Full documentation in your Terminal
Connecting the Dots
Today we covered the full arc: from the emotional chaos of “something is slow” to the methodical process of observing, hypothesizing, measuring, and interpreting. We learned to read Weight and Self-Weight the way a pathologist reads a biopsy — not just looking at numbers, but understanding what they reveal about the structure of the problem. We mastered the three Call Tree surgery operations that separate beginners from experts. And we saw how to scale our profiling from local development to continuous integration.
The ladder is clear: always start with Time Profiler. It’s the most balanced tool, the one that appears in most templates, and the one that solves 90% of problems. Only when you identify a section that needs micro-optimization or you want to do “archaeology” inside a closed framework, scale up to CPU Profiler or Processor Trace.
If you can’t measure performance automatically, you can’t protect it automatically. And if you can’t protect it, every deploy is a leap of faith.
So far we’ve focused on CPU — where processing time is spent. But there’s another half of the equation that can silently degrade your app: memory. Retain cycles that never release, runaway allocations, zombie objects that crash your app days after being freed.
References
- Analyzing CPU Usage with the Time Profiler — Apple Documentation — Apple’s official documentation on the Time Profiler instrument.
- Getting Started with Instruments — WWDC19 — Apple session covering Instruments fundamentals, including Call Tree manipulation.
- Improving App Responsiveness — Apple Documentation — Apple’s guide on hangs, hitches, and best practices for keeping the main thread free.
- xctrace — Apple Developer Man Pages — Complete reference for the xctrace command-line tool.
- Hacking with Swift: How to use Instruments — Paul Hudson — Paul Hudson’s practical guide to optimizing with Instruments.
- Xcode Instruments Time Profiler — Antoine van der Lee — Antoine van der Lee’s tutorial on effective Time Profiler usage.
Related
-
- swift
- swift-zero-expert
- swift-fundamentals
Swift from Zero to Expert #11: Optionals & Optional Chaining
Swift's antidote to the billion-dollar mistake. Optional is just an enum — and nil, if let, guard let, ??, !, and optional chaining all compile down to checking which case you're in.
-
- swift
- swift-zero-expert
- swift-fundamentals
Swift from Zero to Expert #10: Inheritance & Initialization
Subclassing, overriding, and super. Designated vs convenience initializers, two-phase initialization, failable and required init, and deinit — the full lifecycle of a class, explained in memory.
-
- swift
- swift-zero-expert
- swift-fundamentals
Swift Zero to Expert #9: Properties, methods, and subscripts
Stored vs computed properties, observers, lazy, static. How properties define the memory layout and why computed = zero storage.