Mastering Xcode Instruments: Mental Models, Bottlenecks, and Signposts
Learn to think like a performance detective. We break down Instruments from mental models to practical hang resolution and code instrumentation with Signposts.
There’s a tool in the Apple ecosystem that everyone knows by name, that many of us opened once out of curiosity, and that almost nobody masters. It’s called Instruments. And it’s not your fault if you’ve been avoiding it — the interface is intimidating, the data is overwhelming, and the learning curve is steep.
But here’s the uncomfortable truth: if you don’t know how to profile your app, you’re guessing. And guessing about performance is like trying to fix an engine with your eyes closed.
Instruments isn’t just a profiling tool — it’s a complete platform for recording, visualizing, and analyzing what’s really happening inside your app.
This is the first article in a series where we’ll break down Instruments piece by piece. Not from abstract theory, but from real problems, real code, and diagnostics you can apply tomorrow in your project. Today we start with the fundamentals: how to think about performance, how to navigate Instruments without getting lost, and how to use Signposts to make the invisible visible.
The Three Mental Models of Performance
Before opening Instruments, you need to build something more important than technical skill: you need to build mental models. Without them, you’ll see data without understanding what it means.
Think of an MRI scan. There are three distinct roles involved:
-
The MRI technician knows exactly which button to press, how to configure the machine, how to position the patient. In our world, this means knowing how to navigate Instruments — where to click, which template to choose, how to filter data.
-
The doctor spent years understanding how a healthy body works. They know what’s normal. For us, this means understanding the fundamentals: how memory works (stack vs. heap), what the main thread is, how the operating system schedules work, why a frame must be ready every 16.7ms on a 60Hz display — or every 8.3ms on a 120Hz one.
-
The pathologist is the one who looks at the results and says: “this isn’t right.” That’s the diagnosis. In our case, it’s the ability to look at a trace in Instruments and say: “here’s the bottleneck, and this is what’s causing it.”
The secret nobody tells you
You don’t need to master all three models at once. But you do need to know which one you’re working on at any given moment. Are you learning the tool? Are you studying the system fundamentals? Or are you diagnosing a real problem? Separating this mentally saves you hours of frustration.
Becoming a performance expert is nothing more than the process of continuously refining these three mental models. And the good news is that every problem you solve strengthens them.
Navigating the Instruments Arsenal
In Instruments 16, Apple gives us 60 different instruments and 25 predefined templates. Sounds overwhelming, but you don’t need to memorize them all — not even close.
The strategy is simple: master the ones that appear most frequently. The Time Profiler appears in 13 different templates. The Hangs instrument appears in 10. If you master those two, you already cover a huge number of scenarios.
How to Start a Session
From Xcode, you have two key shortcuts:
Cmd + I— Build and open Instruments for profilingCtrl + Cmd + I— Open Instruments without rebuilding (useful when you already have a recent build)
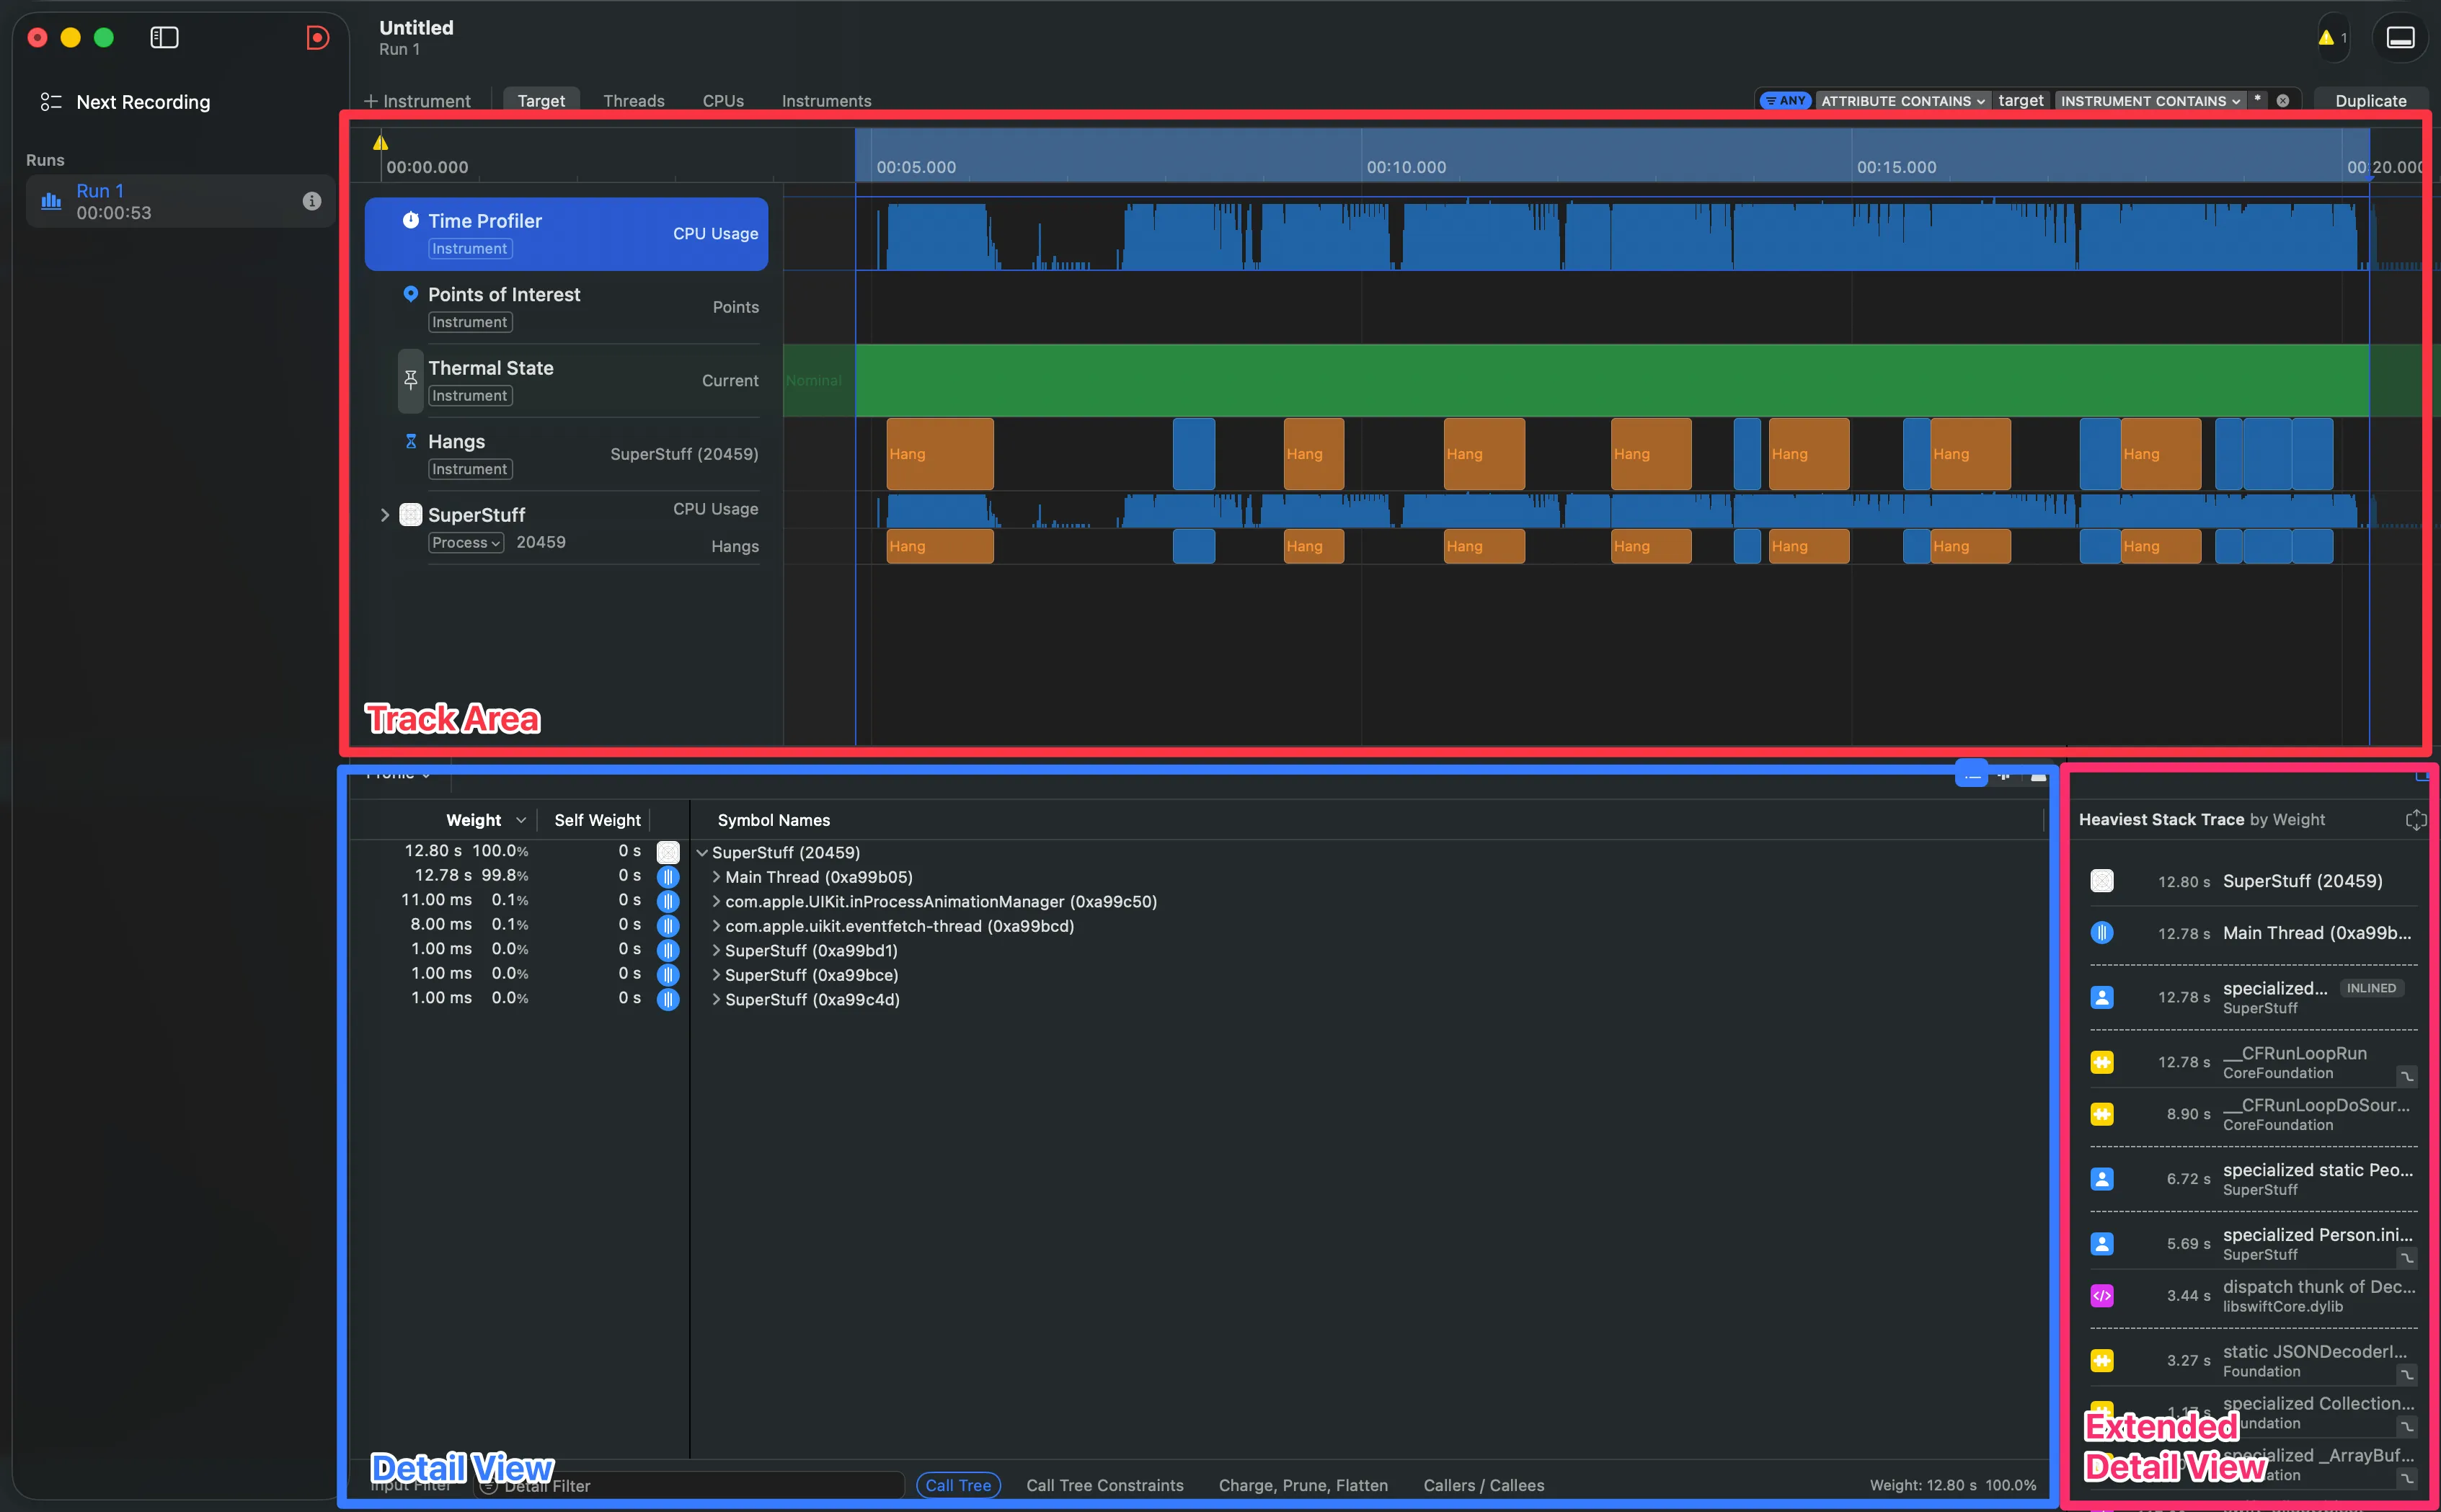
The Three Areas of the Interface
Once you start a recording and stop it, the Instruments window splits into three zones you need to identify:
- Track Area (top): The timelines. Each instrument has its own visual track. This is where you see the full movie of what happened.
- Detail View (bottom): The aggregated data — call trees, event lists, counts. This is where the evidence lives.
- Extended Detail View (right panel): The heaviest stack trace. When you select something in the Detail View, this shows you exactly which call chain consumed the most resources.
The shortcut you'll use the most
Click and drag on the timeline to create an Inspection Range — a range that filters all data to that time segment. Then press Cmd + Ctrl + Z to zoom into that range. This is essential: it lets you focus on the exact moment of the problem without the noise from the rest of the session.
Finding the Bottleneck: A Real Case
Theory is fine, but let’s get our hands dirty. We have an app called SuperStuff that displays a list of GitHub profiles loaded from a JSON file. The app is simple: a UITableView with cells showing each user’s name.
The problem is that scrolling feels terrible. It’s not smooth like butter. Not even like margarine. It feels like you’re dragging the table through cement.
The Suspicious Code
Let’s look at PeopleStore, the class that manages the data:
class PeopleStore {

    static var people: [Person] {
        guard let url = Bundle.main.url(forResource: "people", withExtension: "json") else {
            return []
        }

        guard let jsonData = try? Data(contentsOf: url) else {
            return []
        }

        let decoder = JSONDecoder()
        decoder.keyDecodingStrategy = .convertFromSnakeCase
        do {
            let returnValue = try decoder.decode([Person].self, from: jsonData)
            return returnValue
        }
        catch {
            print(error)
            return []
        }
    }
}
See it? people is a computed property (var people: [Person]). Every time someone accesses it, the JSON file is read from disk and all 11,000+ records are decoded from scratch. Every. Single. Time.
And now look at who’s using it:
class PersonTableViewController: UITableViewController {

    private var people: [Person] {
        PeopleStore.people  // ← Every access triggers the full decode
    }

    override func tableView(_ tableView: UITableView, numberOfRowsInSection section: Int) -> Int {
        return people.count  // ← Decodes here
    }

    override func tableView(_ tableView: UITableView, cellForRowAt indexPath: IndexPath) -> UITableViewCell {
        let cell = tableView.dequeueReusableCell(withIdentifier: "PersonCell", for: indexPath)
        let person = people[indexPath.row]  // ← And here, for EVERY cell
        cell.textLabel?.text = person.login
        return cell
    }
}
Every cell drawn on screen triggers a full JSON read. With aggressive scrolling, that can mean hundreds of decode operations in seconds.
But let’s say you don’t know the code. Let’s say you inherited this project and all you know is “scrolling is slow.” This is where Instruments shines.
The Time Profiler Diagnosis
When profiling with the Time Profiler template and scrolling aggressively, you’ll see two things immediately in the Track Area:
- Massive CPU spikes — the graph shoots up every time you scroll
- Hang markers — red and orange blocks indicating the main thread didn’t respond in time
When you look at the Detail View, the Call Tree can be overwhelming. Thousands of calls to Apple’s internal frameworks that you didn’t write. It’s easy to get lost here.
The Golden Trick: Hide System Libraries
At the bottom of the Detail View, there’s a filter button for the Call Tree. Select “Hide System Libraries”. This is transformative: it filters out all of Apple’s code and assigns that time directly to your code that originated the call.
In our case, the result is brutal: 95.4% of the time is spent in cellForRowAt. The bottleneck is exposed without ambiguity.
- Profile with the Time Profiler template (
Cmd + I) - Reproduce the problem (scroll, navigation, whatever is slow)
- Create an Inspection Range over the problematic zone
- Enable “Hide System Libraries” in the Call Tree filter
- Look for the highest percentage — that’s your entry point
- Read the stack trace in the Extended Detail View to understand the full chain

Signposts: Make the Invisible Visible in Instruments
Time Profiler is powerful for measuring CPU, but it has a blind spot: it doesn’t understand the semantics of your code. It doesn’t know when a download starts, when an image is being processed, or when a file is being read. It only sees functions executing.
This is where the OSSignposter API from the os framework comes in. According to Apple’s official documentation, OSSignposter lets you create semantic intervals that appear as visual tracks in Instruments, using the same subsystem and category system from unified logging.
The best part: the performance impact is virtually zero. You can leave signposts in even in production builds.
Instrumenting the Code
Let’s wrap the JSON loading with a signpost to see exactly what’s happening:
import os

class PeopleStore {

    private static let signposter = OSSignposter(
        subsystem: "com.superstuff.data",
        category: .pointsOfInterest
    )

    static var people: [Person] {
        let signpostID = signposter.makeSignpostID()
        let state = signposter.beginInterval("Loading JSON", id: signpostID)
        defer { signposter.endInterval("Loading JSON", state) }

        guard let url = Bundle.main.url(forResource: "people", withExtension: "json") else {
            return []
        }

        guard let jsonData = try? Data(contentsOf: url) else {
            return []
        }

        let decoder = JSONDecoder()
        decoder.keyDecodingStrategy = .convertFromSnakeCase
        do {
            return try decoder.decode([Person].self, from: jsonData)
        }
        catch {
            print(error)
            return []
        }
    }
}
Notice three key things:
- We create an
OSSignposterwith the.pointsOfInterestcategory — this makes the intervals automatically appear in the “Points of Interest” track in Instruments - We use
makeSignpostID()to generate a unique identifier that allows Instruments to distinguish between concurrent invocations of the same interval - We use
deferto close the interval — so it closes regardless of whichreturnthe function exits through
defer is your best friend with Signposts
Always use defer to close a signpost interval. If your function has multiple exit points (like our guard statements), forgetting to close the interval in one of them will leave orphaned intervals that pollute your data in Instruments.
What the Signposts Reveal
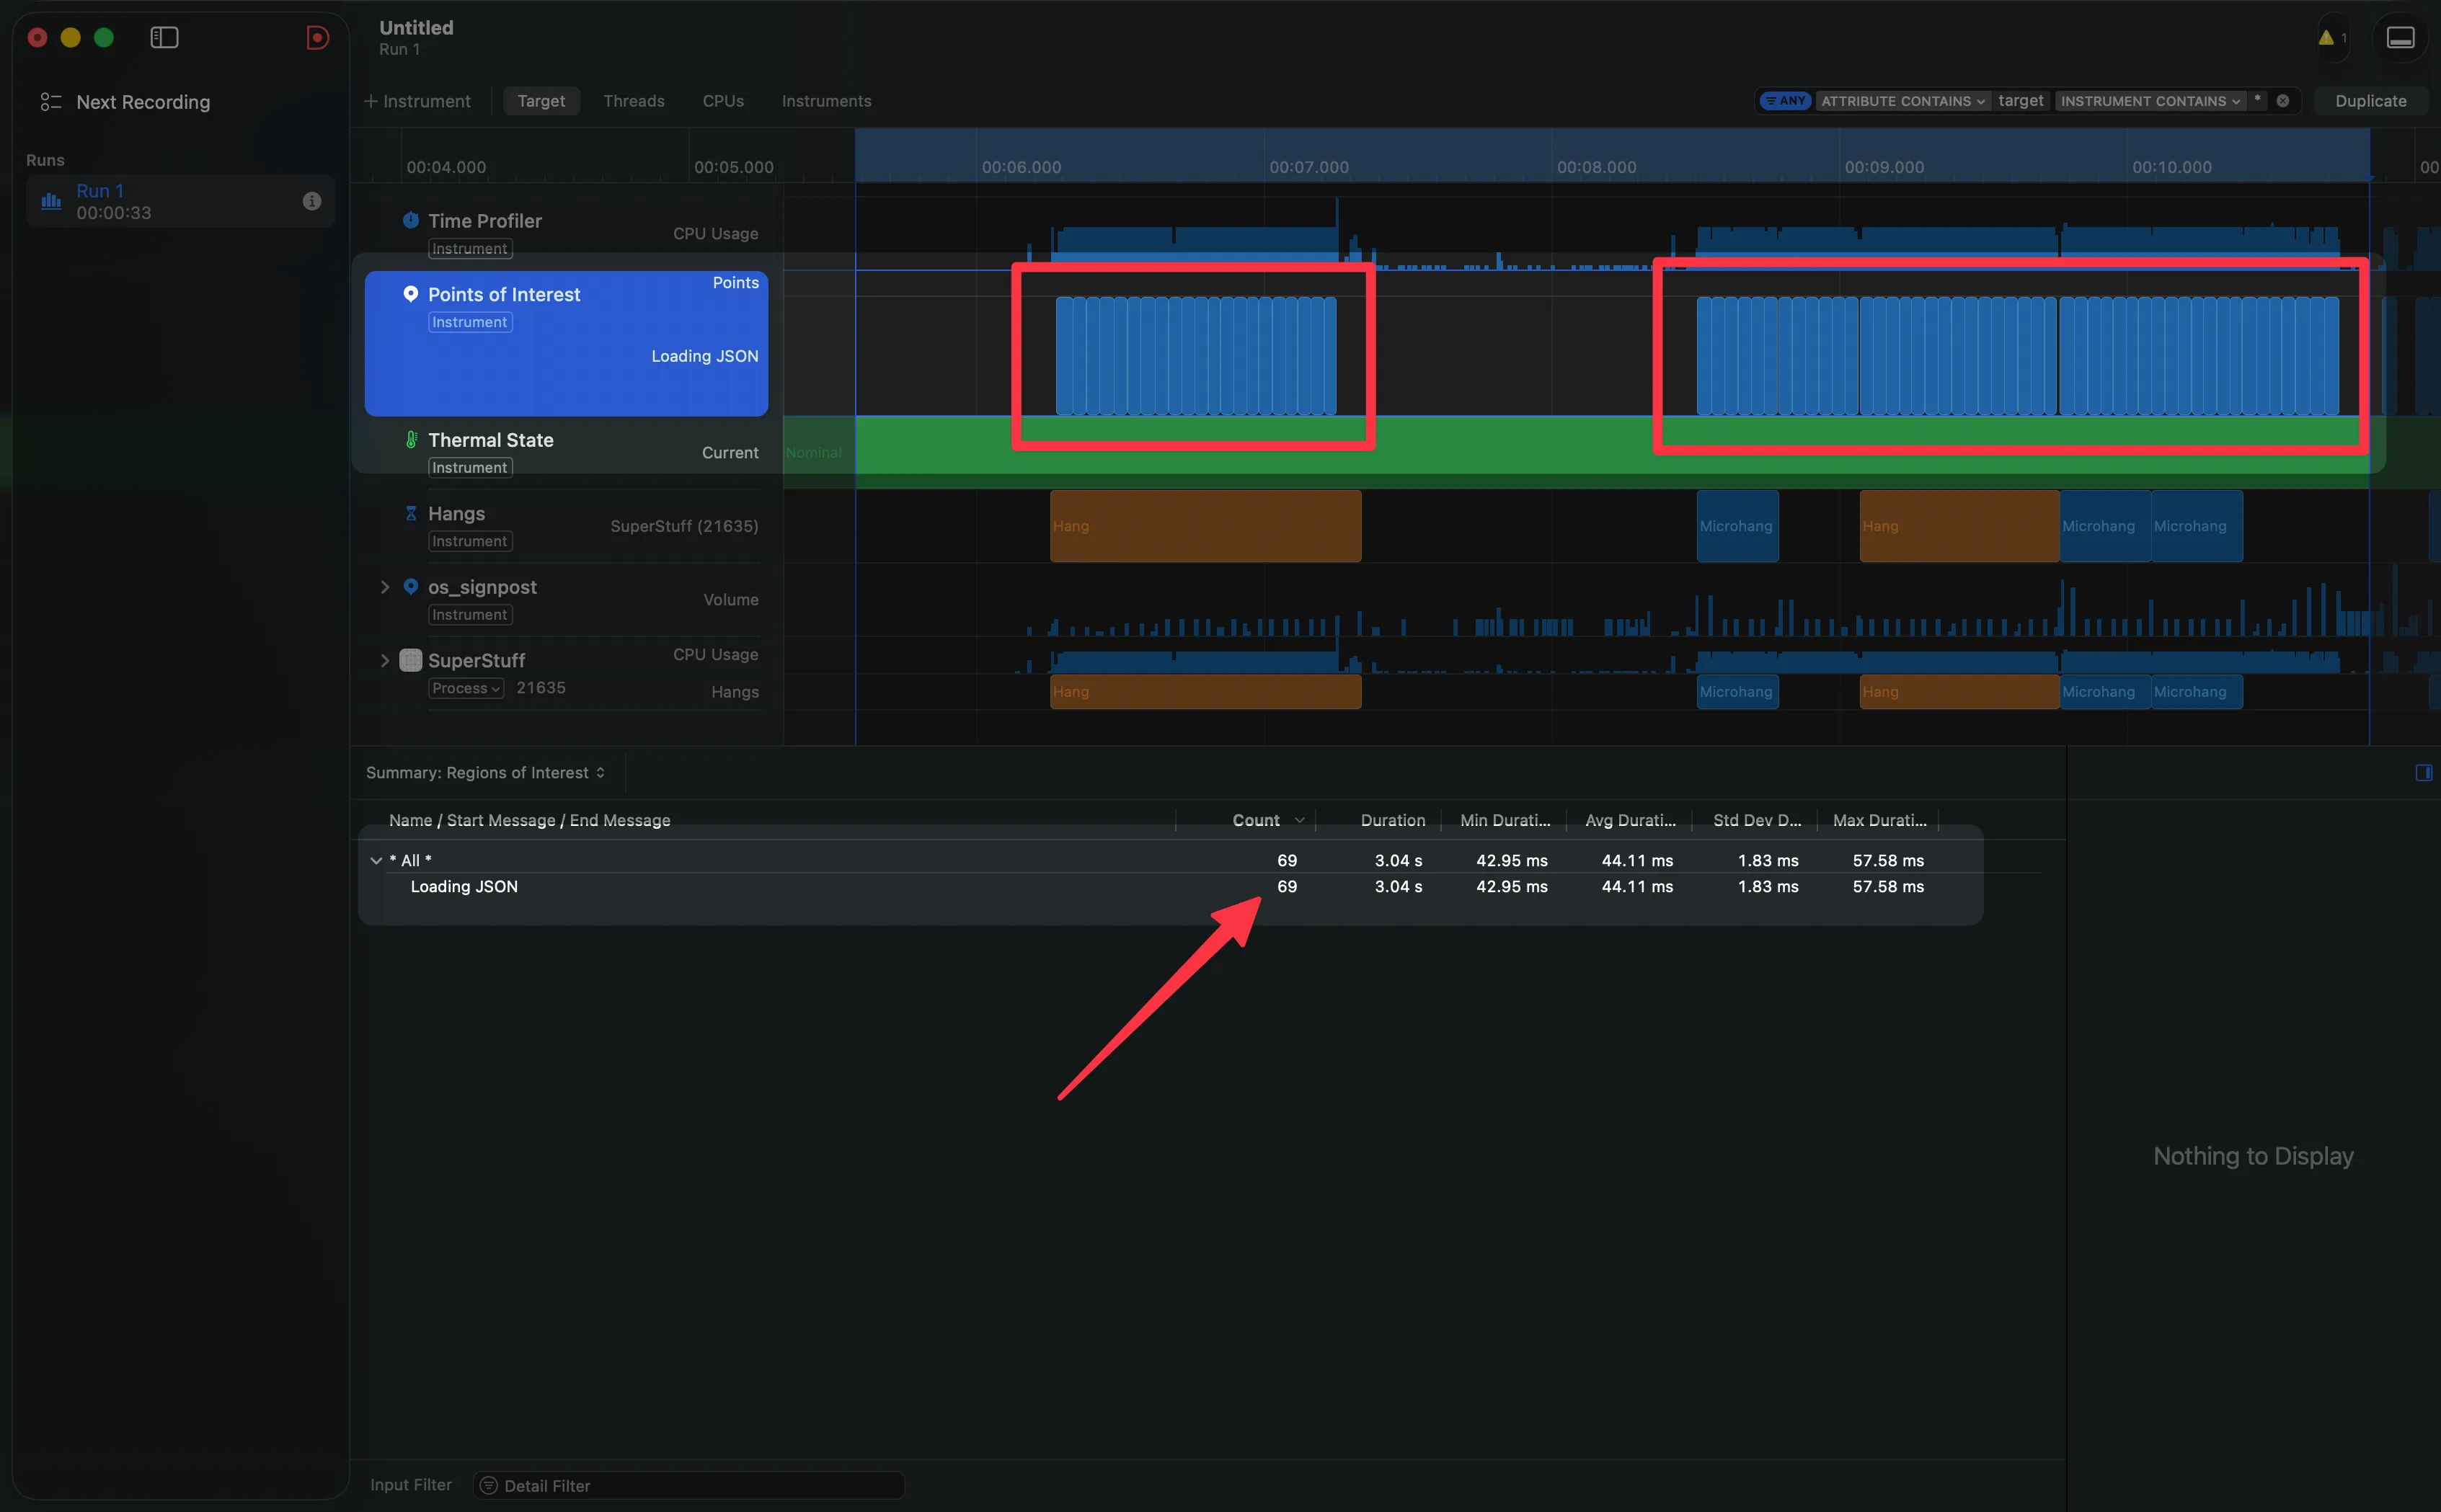
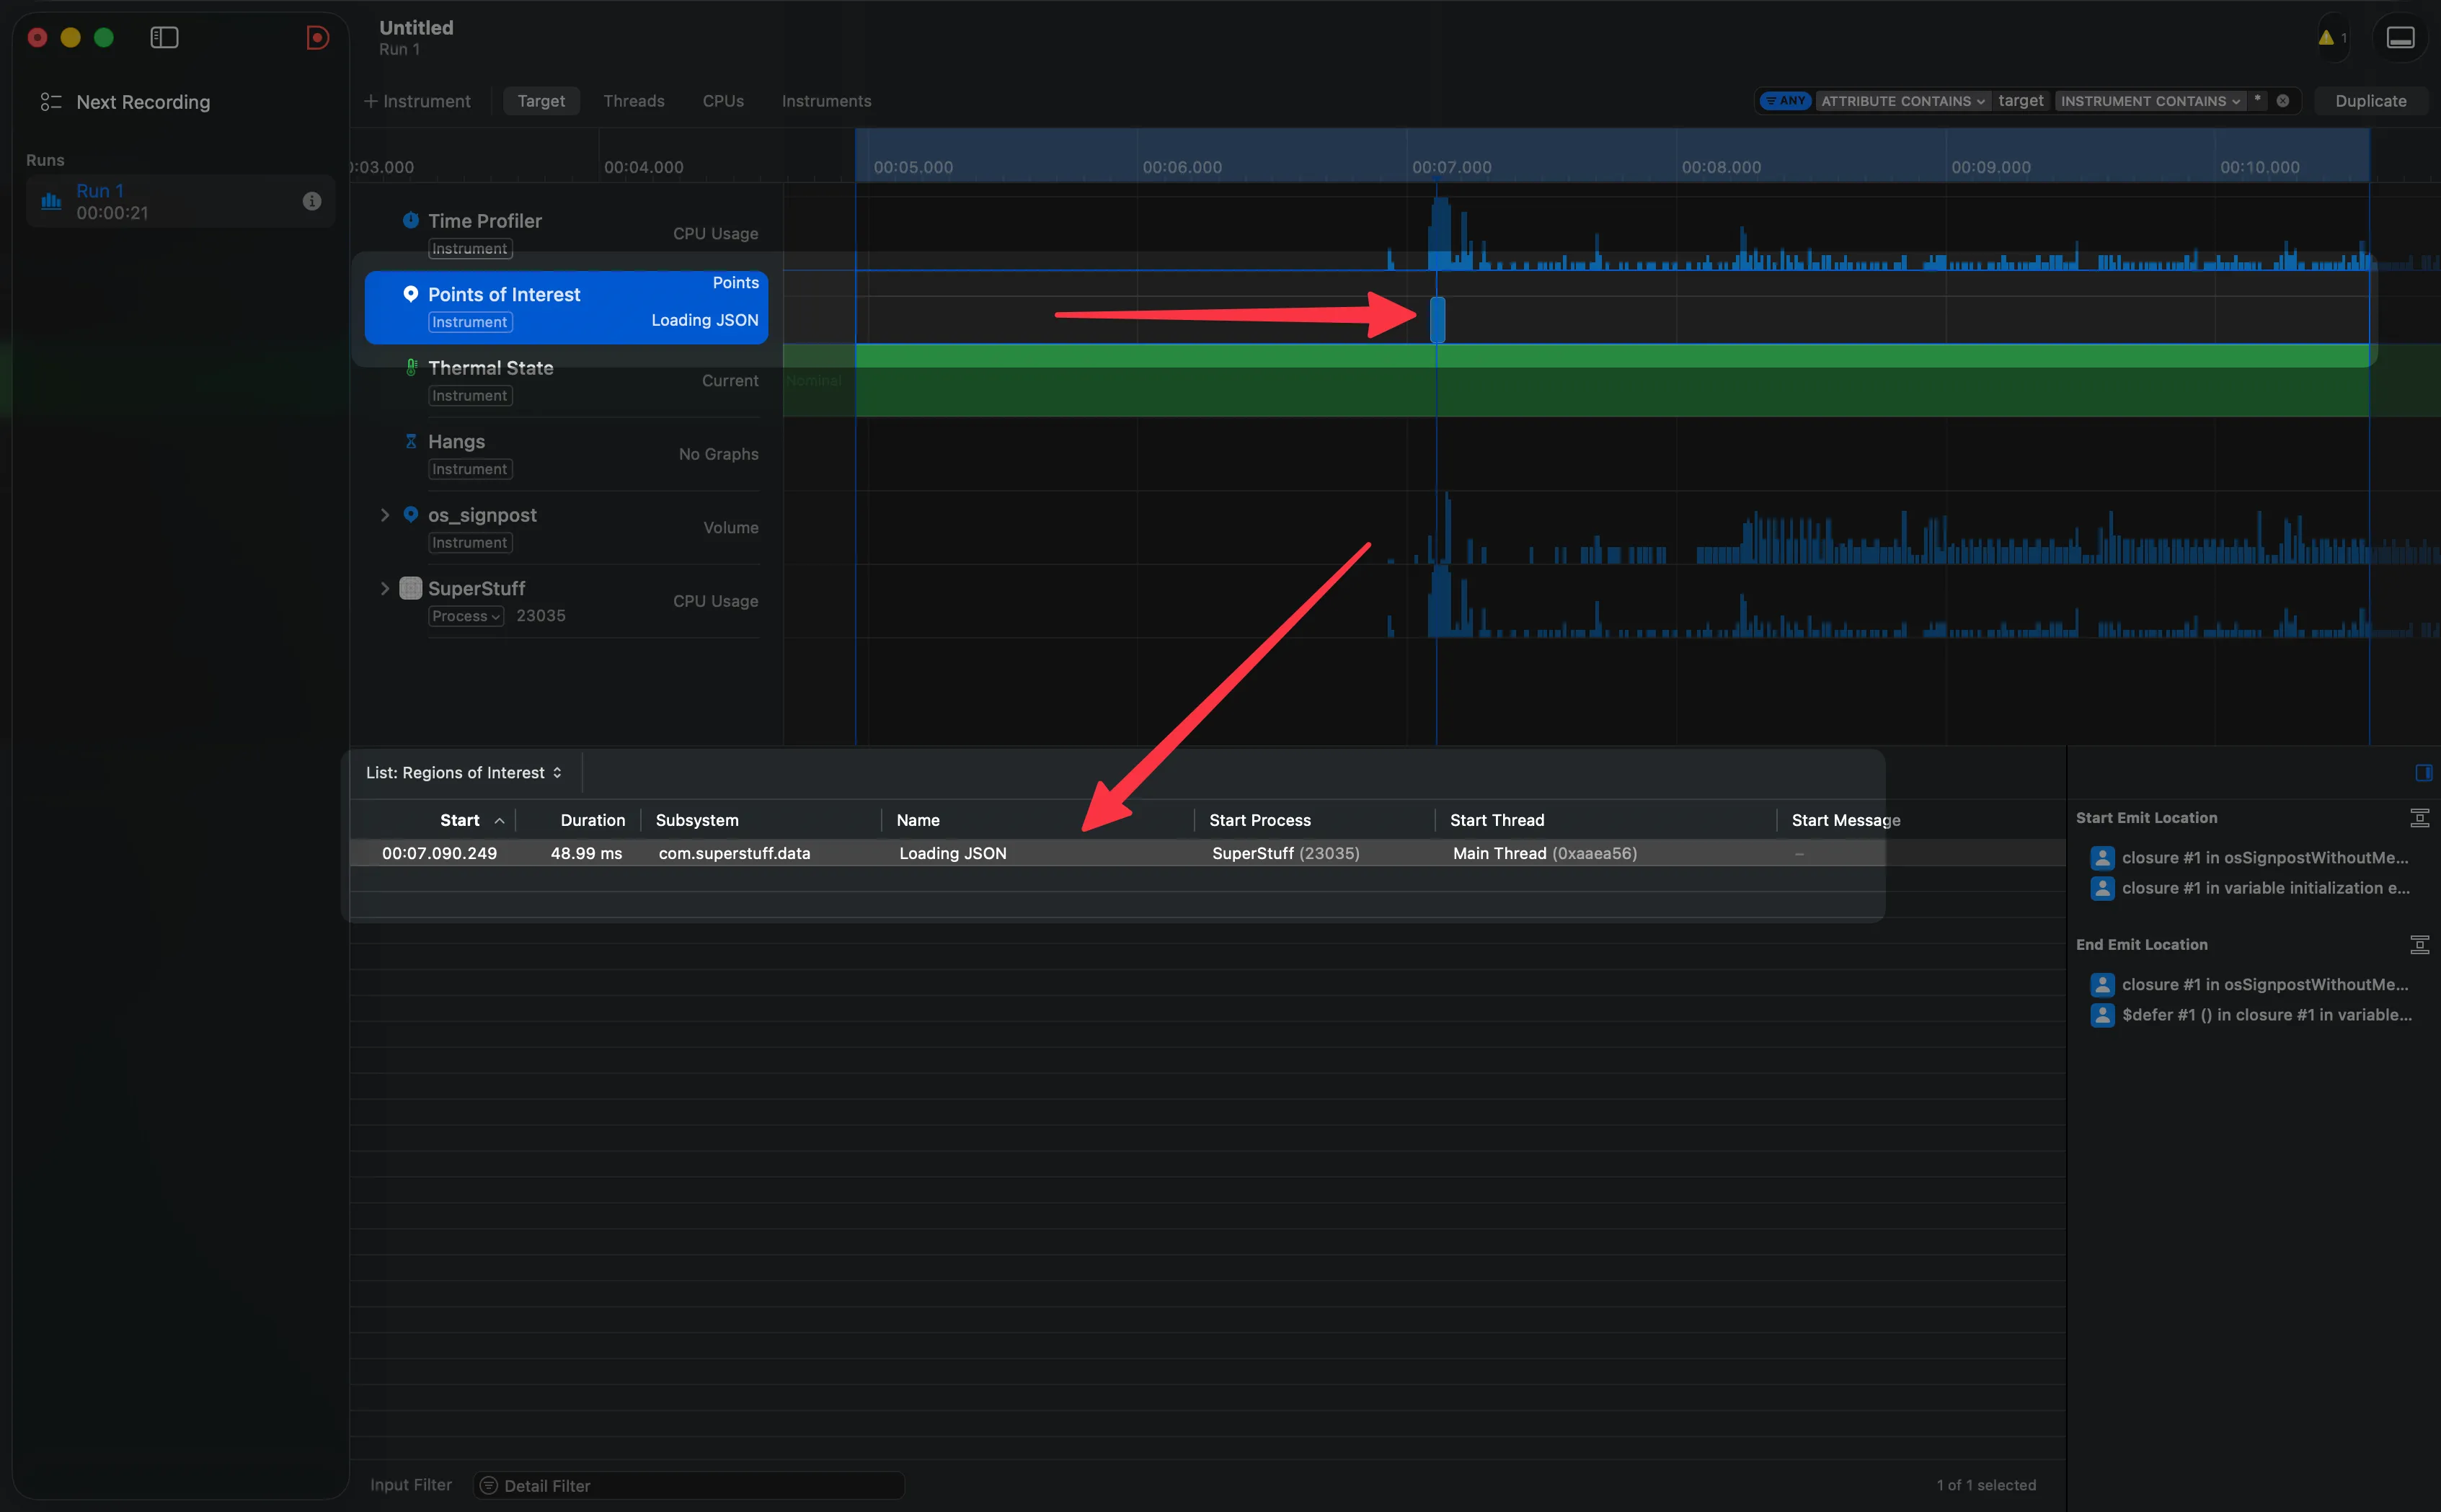
Now we profile again, scroll… and the Points of Interest track tells the whole story without needing to interpret call trees:
An endless sequence of “Loading JSON” blocks. One after another. Dozens — or hundreds — of them. In the summary view you can see the exact count — for example, 69 times in just 3 seconds of scrolling.
The logical error is exposed visually. You don’t need to be an expert at reading Call Trees. The signposts scream it at you.
The Fix: Three Characters That Change Everything
The diagnosis is done. Now the fix. And it’s almost comically simple — change the computed property to one that evaluates only once:
class PeopleStore {

    static let people: [Person] = {
        guard let url = Bundle.main.url(forResource: "people", withExtension: "json") else {
            return []
        }

        guard let jsonData = try? Data(contentsOf: url) else {
            return []
        }

        let decoder = JSONDecoder()
        decoder.keyDecodingStrategy = .convertFromSnakeCase
        do {
            return try decoder.decode([Person].self, from: jsonData)
        }
        catch {
            print(error)
            return []
        }
    }()
}
From var to let, and from a computed property to a closure that executes only once during initialization. The JSON is read and decoded once, stored in memory, and all subsequent reads are instant.
The result when profiling again: the CPU graph drops to minimal levels, the Hangs track is completely empty, and if you keep signposts active, you’ll see a single “Loading JSON” block. One. Scrolling is butter again.
Sometimes the difference between an app that crawls and one that flies is three characters in a line of code. But finding those three characters without the right tools can take days.
A Tip for Team Collaboration
Before closing, something I wish more teams knew: Instruments sessions are saved as documents (.trace files). You can save a trace, close it, and attach it to a ticket in Jira, Linear, or GitHub Issues. Your QA team can open it on their Mac and explore the data exactly as you saw it — without losing any configuration, filters, or collected data.
This changes the conversation from “the app is slow” to “here’s the trace, look at line 47 in the Call Tree.”
What's coming in the series
This was the first article in the Instruments series. We built the mental models, navigated the interface, diagnosed a real problem, and learned to use Signposts to make the invisible visible. In the upcoming articles we’ll go deeper — Memory Graph, Allocations, Network, and more. The idea is that by the end of the series, Instruments stops being that tool you open with dread and becomes your trusted ally.