Mastering Instruments (Part 2): Stack vs. Heap, Symbolication, and Early Detection
Understand how your app manages memory, why dSYMs are critical, and how to detect performance issues before opening Instruments.
In the previous article we compared Instruments to an MRI machine. We learned how to use the machine — the buttons, the templates, the filters. But the MRI technician doesn’t interpret the results. The doctor does. And the doctor needs to understand the patient’s anatomy.
Today it’s our turn to be doctors. We’re going to open up the patient and study what’s inside: how your app organizes memory, what shape the binary takes when it’s loaded onto a device, how the system translates hexadecimal addresses into function names we can actually read, and what tools Xcode gives us to detect problems before we even think about opening Instruments.
Fair warning: this article is denser than the last one. But don’t worry — we’ll go step by step, with metaphors and concrete examples. By the end, you’ll understand things that most iOS developers never stop to learn. And that will give you a massive edge.
If you don’t understand how your app’s memory works, you’re reading an X-ray without having studied anatomy.
The Anatomy of Memory: Stack vs. Heap
Every time your app launches, the operating system assigns it its own virtual memory space — think of it as a giant building full of empty apartments, each with a hexadecimal address on the door. This virtual space is then mapped to the device’s physical memory. You don’t need to know the details of that mapping, but you do need to understand the two zones that are constantly in motion while your app lives: the Stack and the Heap.
The Stack: Fast and Predictable
Each execution thread has its own Stack. It’s a contiguous block of memory — think of it like a stack of plates in a restaurant. When you call a function, a pointer (the Frame Pointer) advances to reserve space for arguments and local variables. When the function returns, the pointer moves back. A plate goes on, a plate comes off. No searching, no negotiation, no bookkeeping.
Allocating memory on the Stack is one of the fastest operations that exist. It’s literally moving a number.
The Heap: Flexible but Costly
This is where dynamically allocated memory lives. In Swift, reference types — class, actor, closures — are stored on the Heap. Even some value types that grow beyond a certain threshold, like a very long String or a large Array, end up there too.
Unlike the Stack, the Heap requires extra work. The system uses primitives like malloc to find a free memory block, record its size, and later free it when ARC (Automatic Reference Counting) determines nobody needs it anymore. That bookkeeping has a cost. And when your app creates thousands of objects on the Heap per second — like decoding a massive JSON dozens of times per second, as we saw in Part 1 — that cost multiplies.
- Value types (
struct,enum, tuples) → generally on the Stack - Reference types (
class,actor, closures) → on the Heap String,Array,Dictionary→ value types, but their internal storage lives on the Heap- Every Heap allocation goes through
malloc+ ARC — that costs CPU cycles - The Stack is cleaned up automatically when the function exits — zero overhead
Mach-O: The Anatomy of Your Binary
We now understand where memory lives at runtime. But what shape does your app take before it runs? What’s inside that file Xcode compiles and the device loads into memory?
The answer is Mach-O (Mach Object) — the binary file format used by all Apple platforms. Every .app you compile, every framework you import, every system dylib… they’re all Mach-O files.
The Suitcase with Compartments
Think of a Mach-O file as a well-organized suitcase with three sections:
-
The Header — The suitcase label. It states which architecture it contains (arm64, x86_64), what type of file it is (executable, library, object), and how many compartments it has. It’s the first thing the system reads to know what to do with the file.
-
The Load Commands — The table of contents. A list of instructions telling the system how to load the binary into memory: which segments to create, which dynamic libraries it needs, where the symbol table is. Every dependency of your app — UIKit, Foundation, SwiftUI — appears here as an
LC_LOAD_DYLIBcommand. -
The Segments and Sections — The actual compartments with the clothes. This is where your code, your data, and your constants live. Organized hierarchically: segments are the large compartments, and sections are the pockets inside each compartment.
The Segments That Matter
When your app is loaded into virtual memory, the Mach-O binary is mapped into segments. These are the ones you need to know:
__PAGEZERO — An invisible but important segment. It occupies virtual address zero with no read or write protection. Why? It’s a safety net: if your code tries to access a nil pointer (address 0), the system catches the access immediately and generates a crash instead of letting your app silently corrupt memory. It takes no space on disk — only in the virtual map.
__TEXT — Your executable code and constant data. It’s read-only. This detail is key: since nobody can write to __TEXT, the operating system can share the same physical copy in RAM across all processes using that library. Your app, the app next door, and ten others running simultaneously all share a single copy of UIKit in __TEXT. Efficient.
__DATA — Variables and data that can change. Read and write. This is where a mechanism called copy-on-write applies: all processes share the same physical page until someone writes to it. At that point, the system creates a private copy just for that process. This saves memory when data doesn’t change, while still allowing mutation when needed.
__LINKEDIT — Information for the dynamic linker (dyld): symbol tables, relocation data, code signatures. You never interact directly with this segment, but without it, nothing would work.
Fat Binaries: A Suitcase Inside a Suitcase
Ever seen the term “Universal Binary”? It’s a special Mach-O file that contains multiple binaries — one per architecture. For example, a Universal Binary can include an arm64 version (for Apple Silicon) and an x86_64 version (for Intel) in the same file.
Technically, a Fat Binary isn’t a Mach-O — it’s a file that contains multiple Mach-Os. It has its own header (fat_header) that states how many architectures it includes and where each one begins. The system reads this header, identifies the device’s architecture, and jumps directly to the correct Mach-O.
Lazy Binding: Looking Up the Number Only When You Need to Call
Your app depends on dozens of system frameworks. But can you imagine if at launch it had to resolve every function from every framework before showing the first screen? The launch time would be unbearable.
That’s why lazy binding exists. Here’s how it works:
- When your app is compiled, calls to external functions (like any UIKit method) don’t point directly to the real function. They point to a stub — a small trampoline in the
__TEXTsegment. - The first time your code calls that function, the stub asks
dyld(the dynamic linker) to find the real function.dyldfinds it, updates the pointer, and next time the call goes direct — no intermediaries.
It’s like having a phone book but not looking up someone’s number until you actually need to call them. Why look up all 500 contacts when you wake up if you’re only going to call three today?
Your app doesn’t load everything at startup. Thanks to lazy binding, it only resolves what it needs, when it needs it. That’s how it launches fast.
The Art of Symbolication
Imagine you profile your app, find a bottleneck, and when you go to see which function is causing it… Instruments shows you 0x1047f3a8c. A hexadecimal number. No context. No name. Useless.
That happens when symbolication fails — the process of converting memory addresses into readable names like cellForRowAt or loadPeople(). And to understand it well, we need to talk about why your app’s addresses change every time you run it.
Step 1: Undoing the ASLR Slide
For security, iOS and macOS apply ASLR (Address Space Layout Randomization) every time an app launches. The kernel adds a random offset — the “slide” — to memory addresses. This makes it harder for an attacker to predict where certain code lives in memory.
Great for security. But it means the address 0x1047f3a8c you see in a crash log isn’t the address that function had when Xcode compiled it. To find the function, you need to undo the slide.
The formula is simple:
ASLR Slide = Load Address - Linker AddressFile Address = Runtime Address - ASLR Slide- The Linker Address is the address Xcode assigned at compile time. You can see it with
otool:
otool -l MyApp | grep LC_SEGMENT -A8# Look for the vmaddr field of the __TEXT segment- The Load Address is where it actually loaded in memory. It appears in the “Binary Images” section of a crash log, or you can get it at runtime:
vmmap MyApp | grep __TEXTWith those two, you calculate the slide and subtract. The resulting address is the one you can look up in the debug information.
Step 2: Querying the Debug Symbols (DWARF)
You now have the on-disk address. Now you need to translate it to a function name and line number. That translation lives in the DWARF (Debugging With Attributed Record Formats) format — the debug information Xcode generates when compiling.
DWARF organizes information into three main streams:
debug_info— The hierarchical structure of your code. Each source file is a “Compile Unit”, each function is a “Subprogram”, and functions the compiler decided to inline appear as “Inlined Subroutines” nested inside the function that contains them.debug_abbrev— Defines the meaning of entries indebug_info. It’s like the dictionary that tells the debugger how to interpret the data.debug_line— The map that connects each machine address to a source file and line number. This is what makes it possible for Instruments to show youmain.swift:36instead of0x1000003b70.
Functions That Disappear: Inlining
In Release builds, the compiler optimizes aggressively. One of its favorite optimizations is inlining: taking a small function and copying its code directly inside the function that calls it, eliminating the call itself.
The result is that the function “disappears” from the binary. It doesn’t exist as a separate entity. And without DWARF, there would be no way to know that block of code was ever an independent function.
DWARF solves this with Inlined Subroutines — entries that record “there was a function called X, it was inlined into Y, and it was originally on line Z of file W”.
# Symbolicate an address with support for inlined functionsatos -o MyApp.dSYM/Contents/Resources/DWARF/MyApp \     -arch arm64 \     -l 0x10045c000 \     -i \     0x10045fb70
# Result: selectMagicNumber(choices:) (in MyApp) (main.swift:11)
dSYMs: The Rosetta Stone of Your Production Builds
In your development builds (Debug), Xcode embeds the DWARF information directly in the binary. Everything works transparently — Instruments, the debugger, crash logs, everything gets symbolicated without you doing anything.
But when you compile for the App Store (Release), Xcode extracts that information and creates a separate file: the dSYM (Debug Symbols Bundle). Why? Because DWARF information can be enormous — up to 4 GB per binary — and you don’t want to ship all of that to your users.
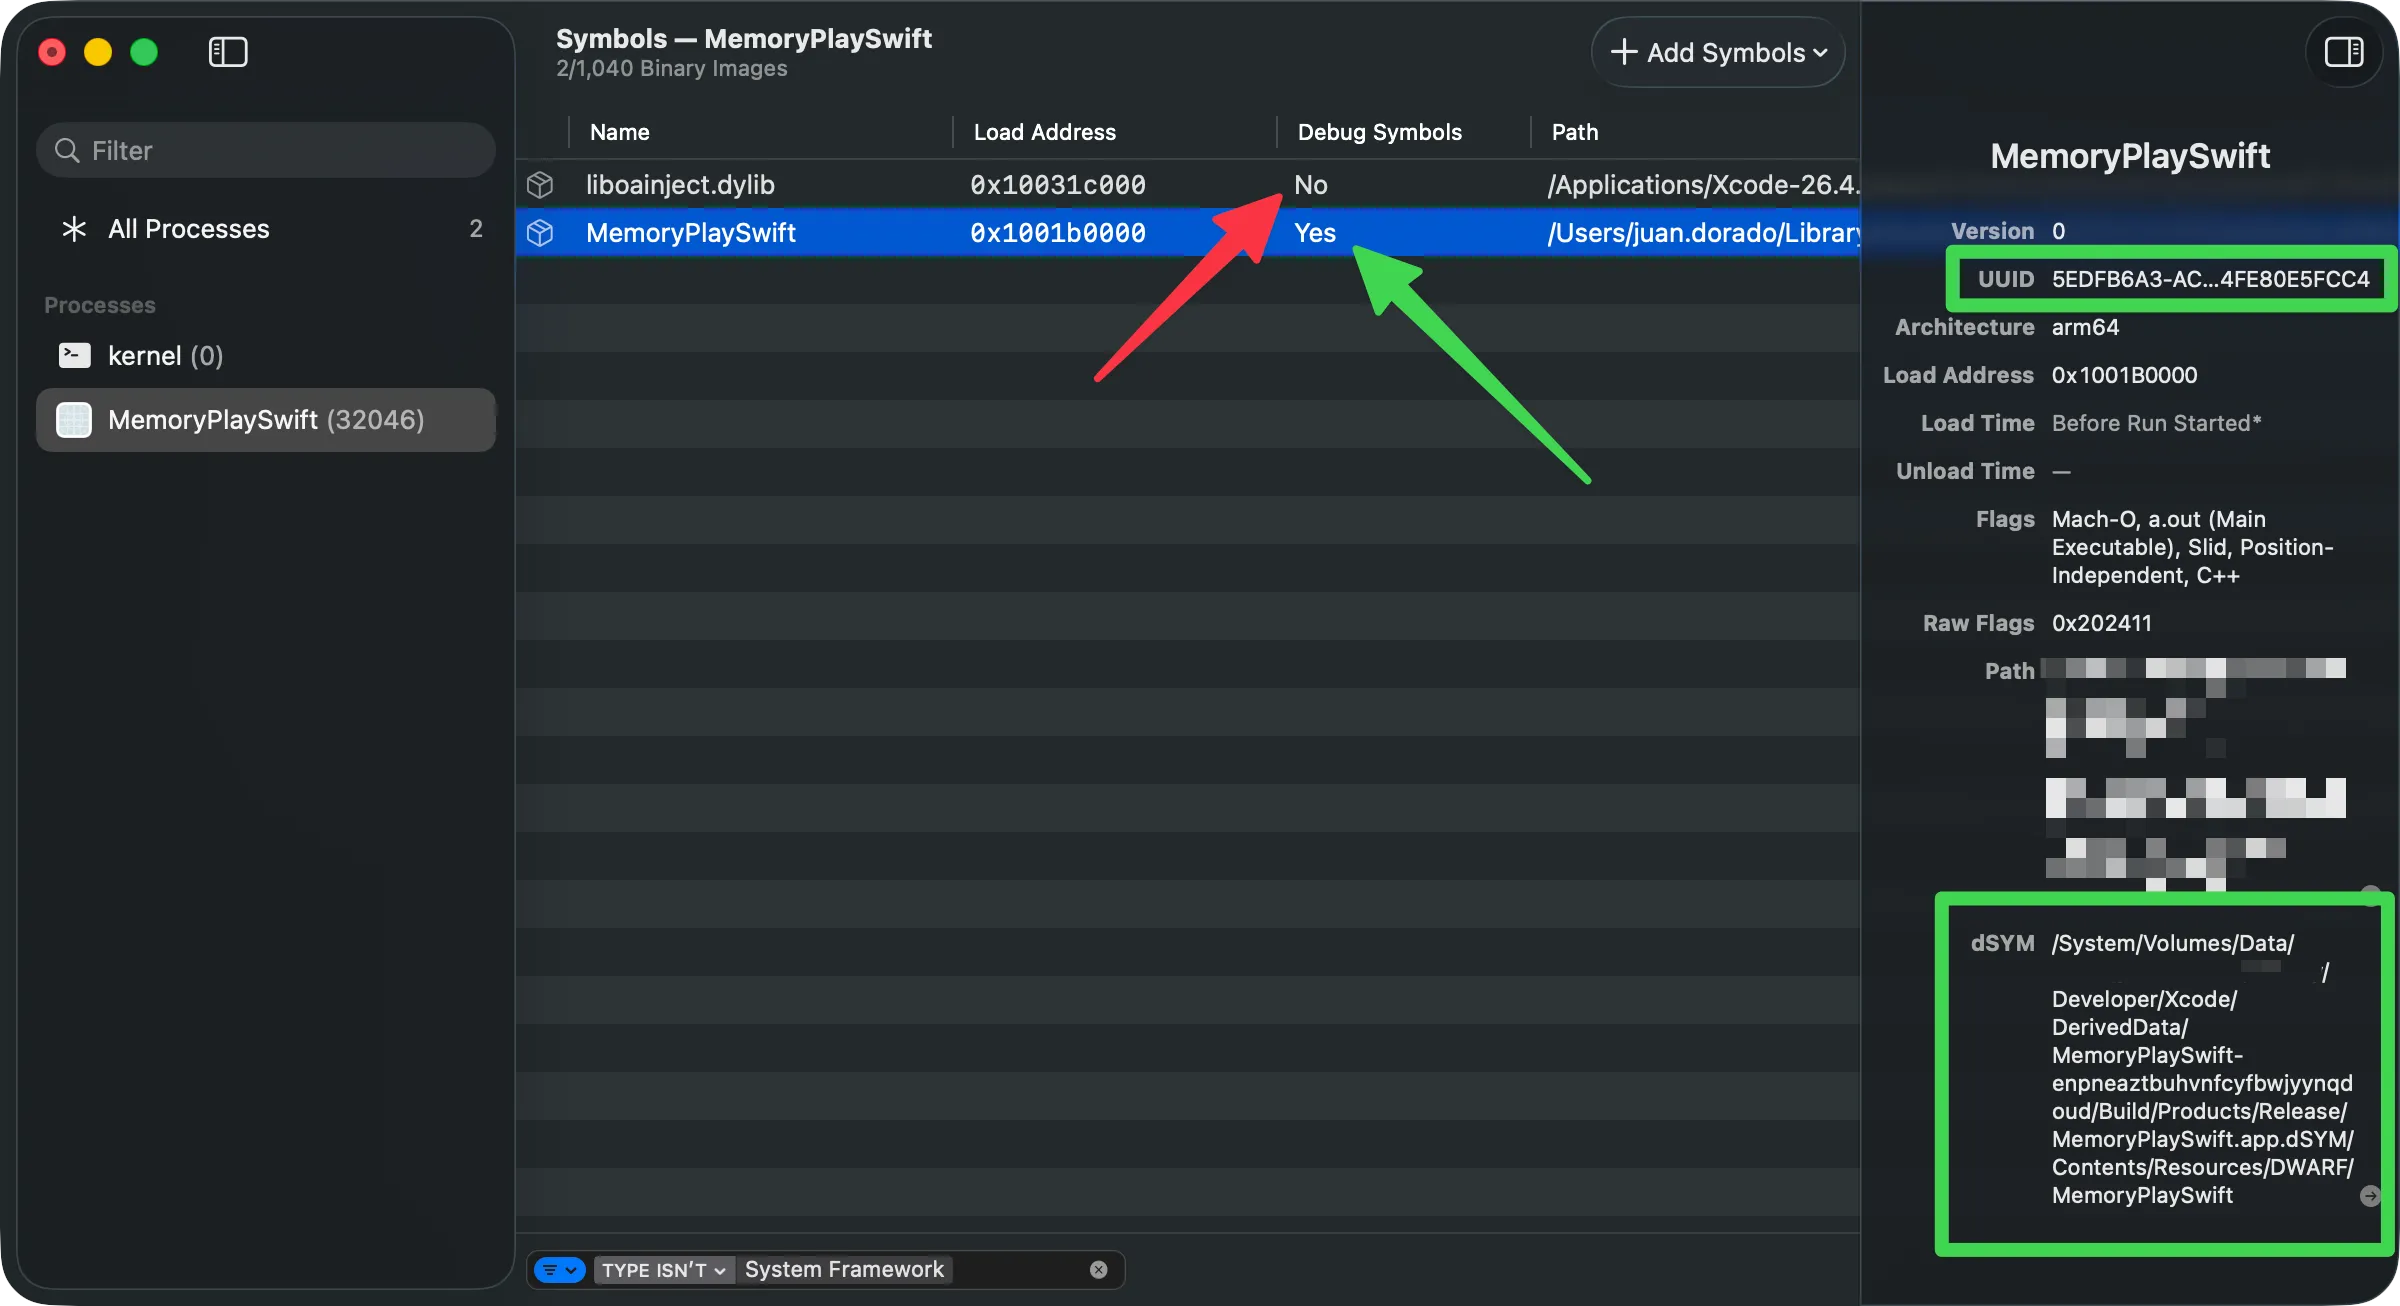
The dSYM is linked to its binary through a UUID — a 128-bit fingerprint that Xcode generates on each build. The same UUID appears in the binary’s header and in the dSYM. When Instruments or Xcode need to symbolicate a crash, they look for the dSYM whose UUID matches exactly with the binary that produced the crash.
# View the UUID of a dSYMsymbols -uuid MyApp.dSYM
# Search for a dSYM by UUID on your Macmdfind "com_apple_xcode_dsym_uuids == ABC123-DEF456-..."
# Verify that the dSYM's DWARF is validdwarfdump --verify MyApp.dSYMThe UUID is the bridge between your production binary and the debug information that stayed on your Mac. If that bridge breaks, you’re in the dark.
Build Settings That Matter
For symbolication to work correctly across your different schemes, check these settings:
- Debug Information Format →
DWARF with dSYM Filefor Release (generates the dSYM at compile time) - Strip Linked Product →
Yesfor Release (reduces binary size by removing unnecessary symbols) - Strip Style →
All Symbolsfor maximum reduction,Non-Globalto keep exported APIs - Code Signing Inject Base Entitlements → enabled (required for Instruments to read symbols in development builds)
- The
get-task-allowentitlement must be present in Debug builds — without it, Instruments cannot symbolicate your app when profiling
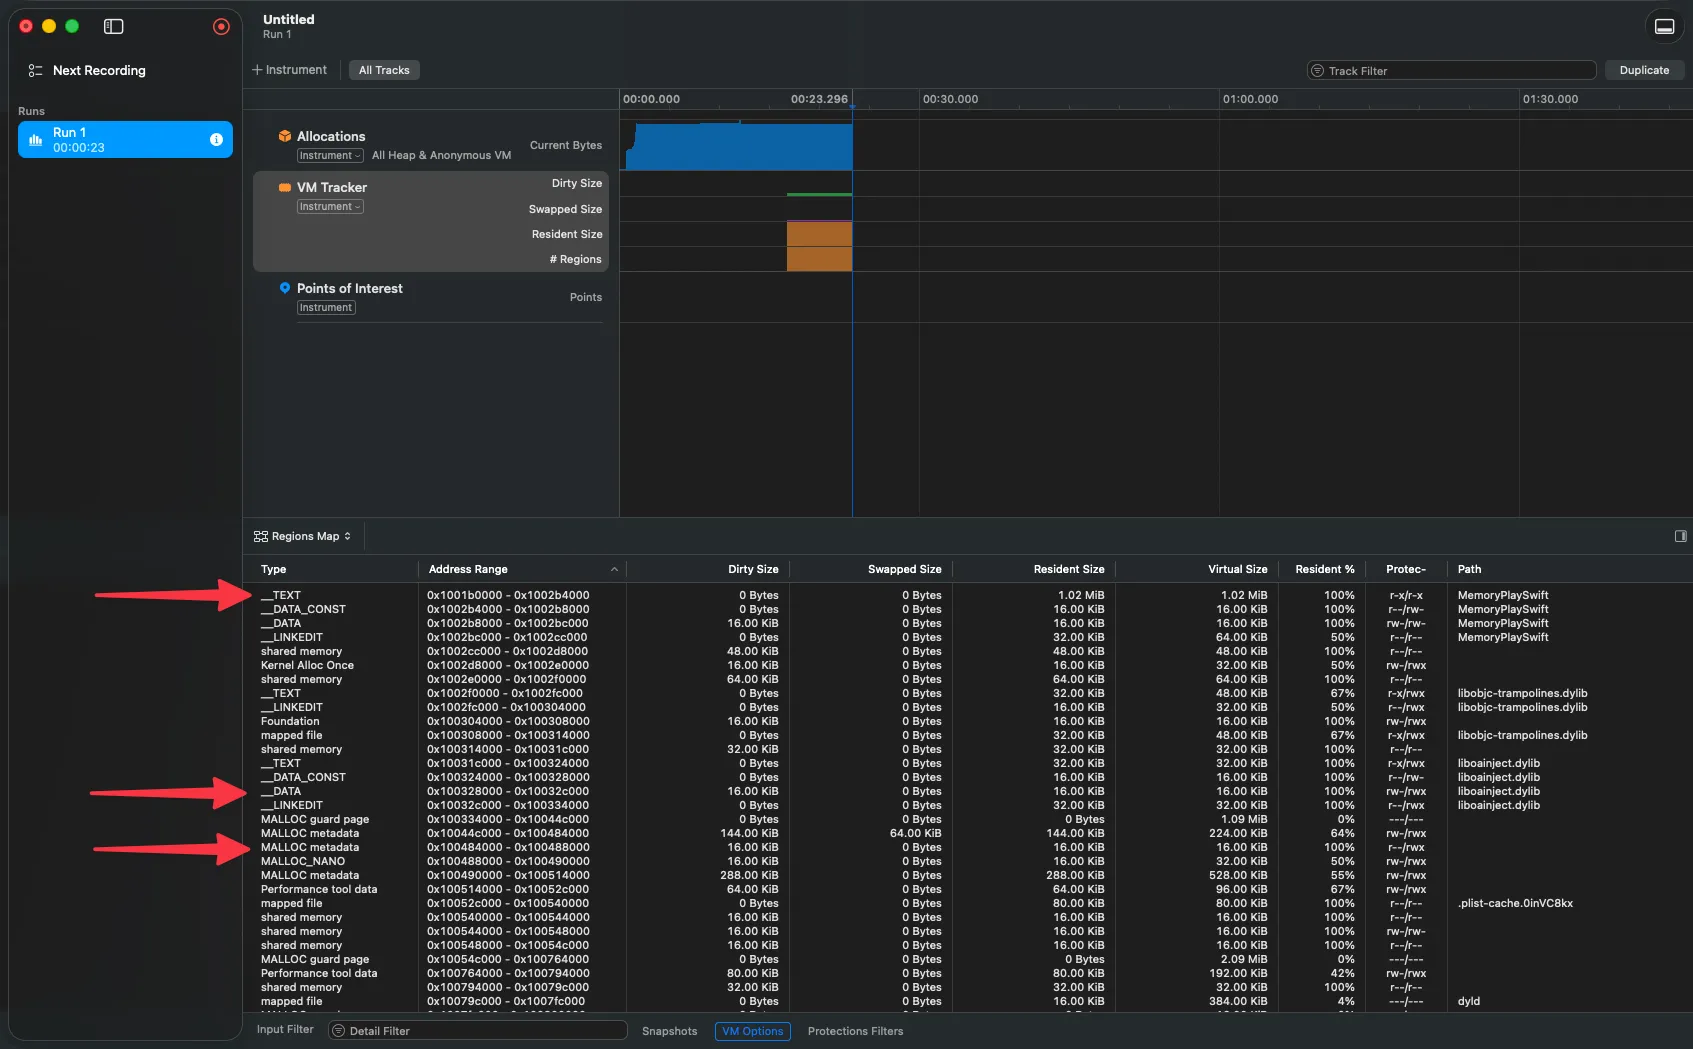
Verifying Symbolication in Instruments
If you open a trace and see your code’s functions as <Unknown> or hex addresses, symbolication failed. You can verify the status from Instruments.
Early Detection: Three Lines of Defense Without Opening Instruments
Instruments is the ultimate diagnostic tool. But you shouldn’t need to open it to find out something is wrong. Xcode gives you three mechanisms to detect problems early — and using them shifts your relationship with performance from reactive to proactive.
1. Xcode Gauges: The Real-Time Monitor
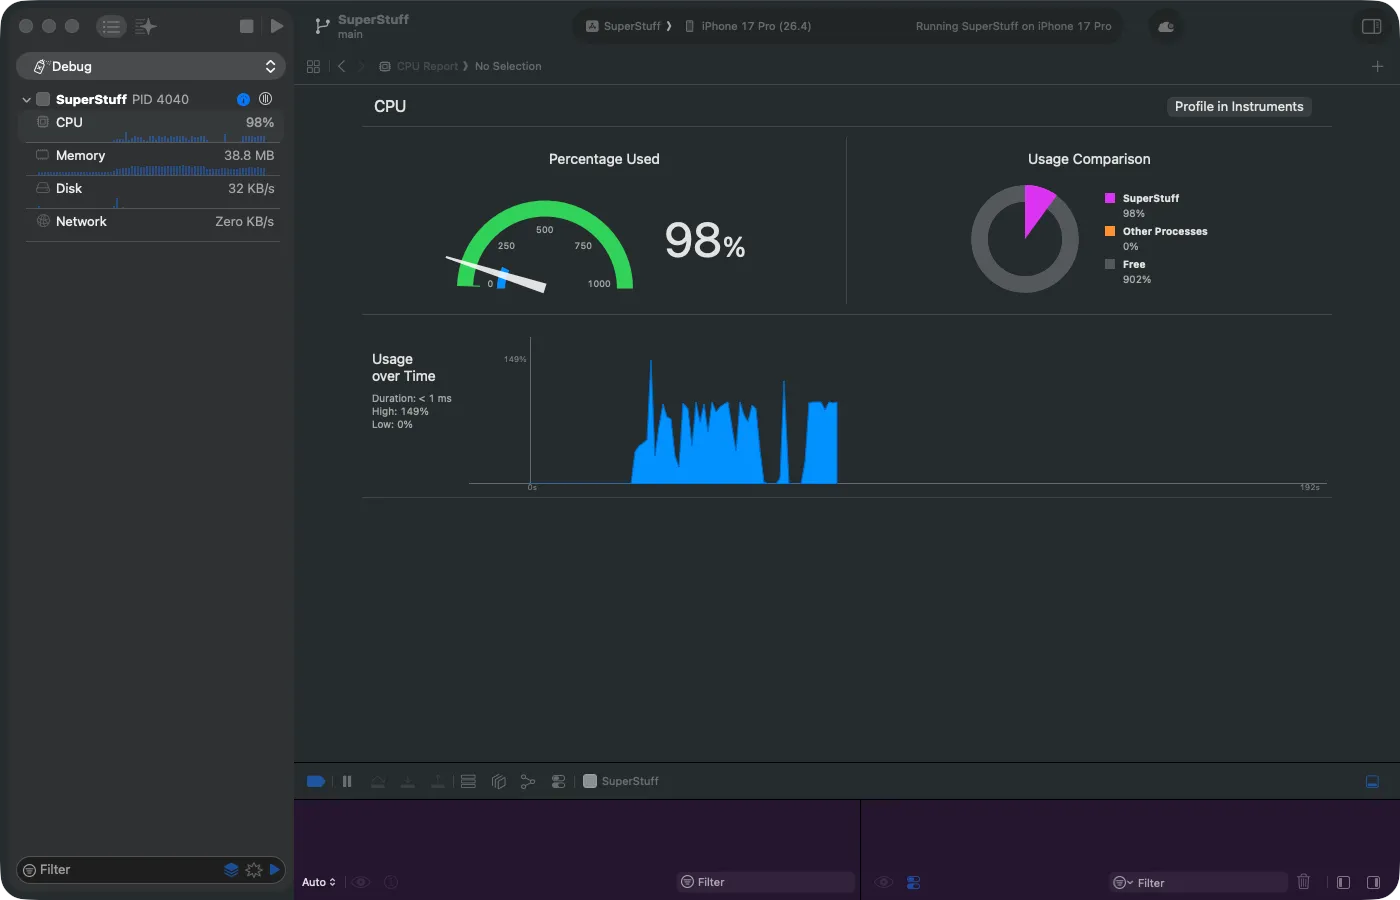
While debugging your app with Cmd + R, Xcode has something hidden in the left panel that few people use: the Debug Gauges. They’re in the Debug Navigator (the bug icon) and show live meters for CPU, Memory, Disk, and Network.
They’re ephemeral — the information disappears when you stop the app. They’re not for deep analysis. But they’re fantastic as an alarm signal. If you scroll through a table and the CPU meter shoots up to 99%… something is very wrong, and you don’t need Instruments to know it.
2. Performance Tests with XCTest
Gauges are manual — you need to be watching. But what if you could automate the detection? That’s what performance tests in XCTest are for.
You wrap critical code in a measure {} block and Xcode runs it 10 consecutive times, calculates the average, and sets it as a baseline. If in the future someone modifies the code and the time spikes beyond the allowed standard deviation, the test fails automatically.
This is gold for teams. A teammate changes something in PeopleStore, CI runs the tests, and if performance degraded, the pipeline catches it before the PR gets merged.
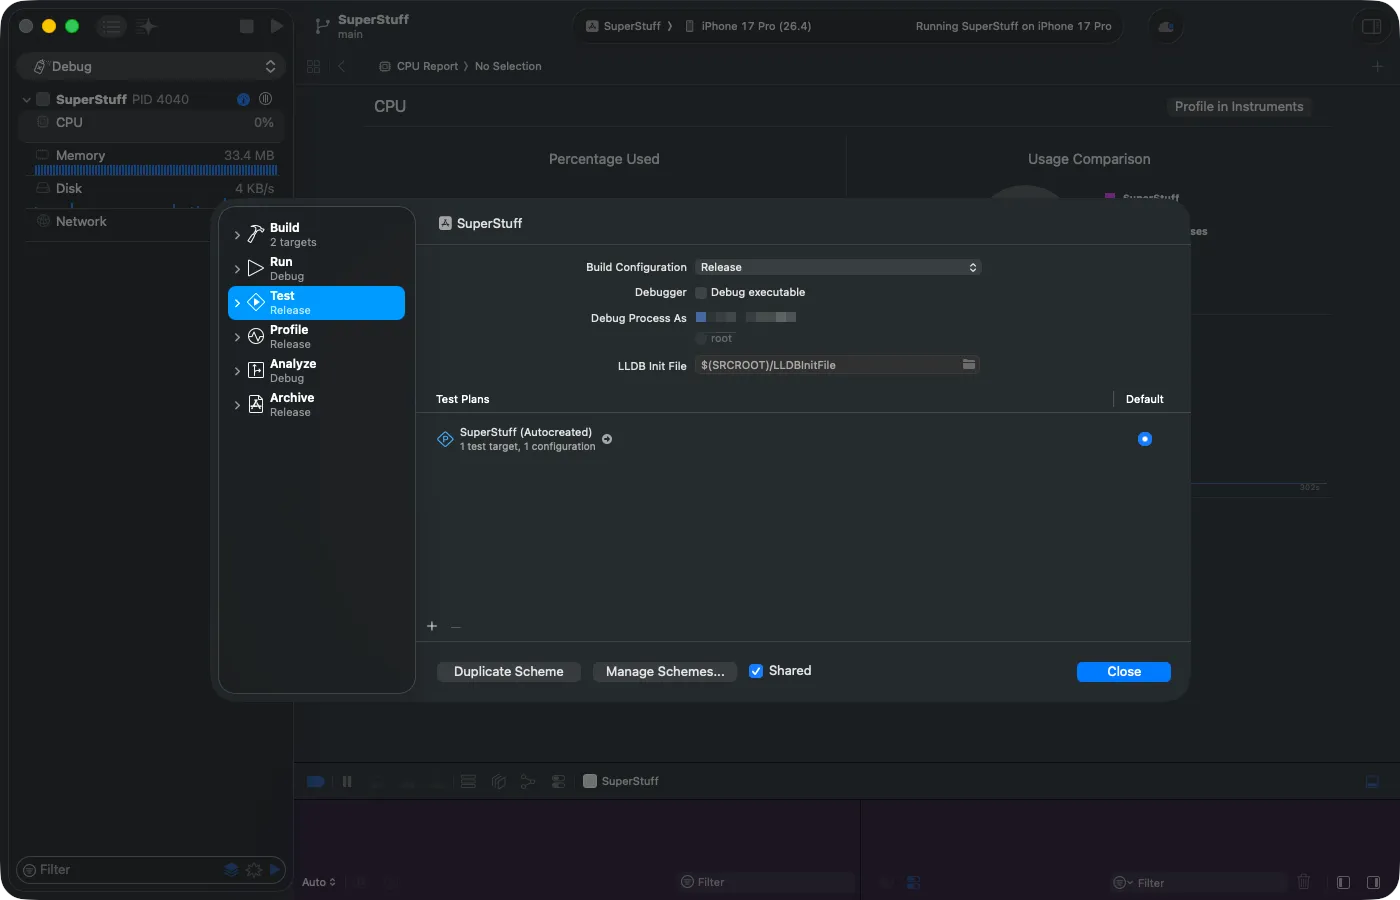
Configuring the Scheme for Accurate Tests
For realistic results, you need to change the Scheme configuration. Go to Product > Scheme > Edit Scheme, select the Test section, change the Build Configuration to Release, and uncheck “Debug executable”. The debugger injects overhead that distorts measurements — without this, your baselines won’t reflect real production performance.
The Error You’ll Encounter (and How to Fix It)
If you get the error “Unable to resolve Swift module dependency to a compatible module: ‘SuperStuff’” when running the test, don’t worry — it’s expected. The culprit is @testable import SuperStuff.
@testable only works in Debug builds because it requires the module to expose its internal symbols. In Release, the compiler hides them as part of optimization. The fix: remove @testable and use just import SuperStuff. However, the types you need to access from the test (PeopleStore, Person) must have public access in the source code.
Running the Test and Reading the Results
Once the import is resolved, run the test. When it finishes, you’ll see an indicator next to the measure {} line number with the average time and a “Show” button:
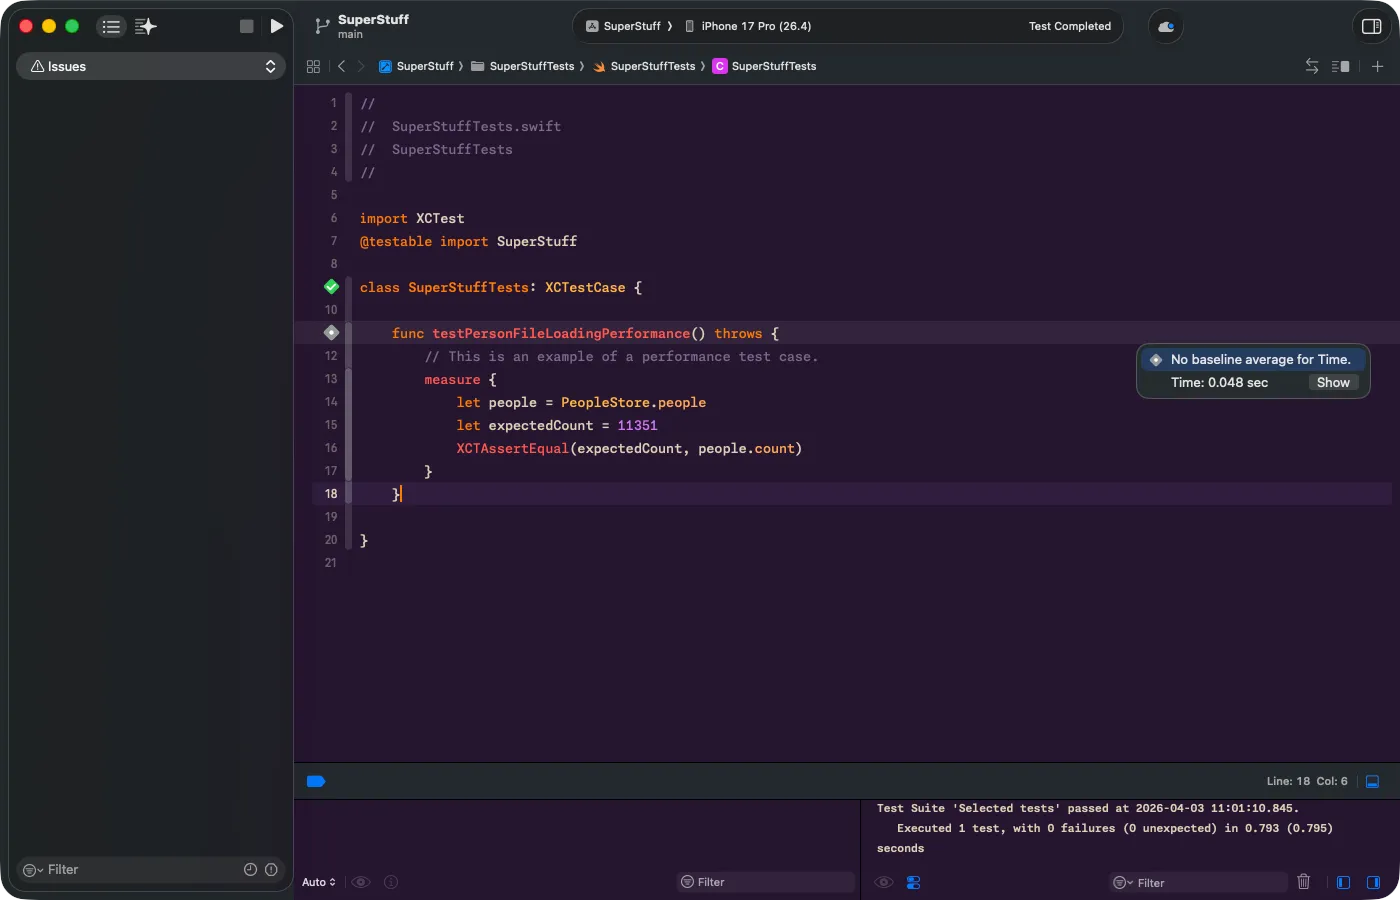
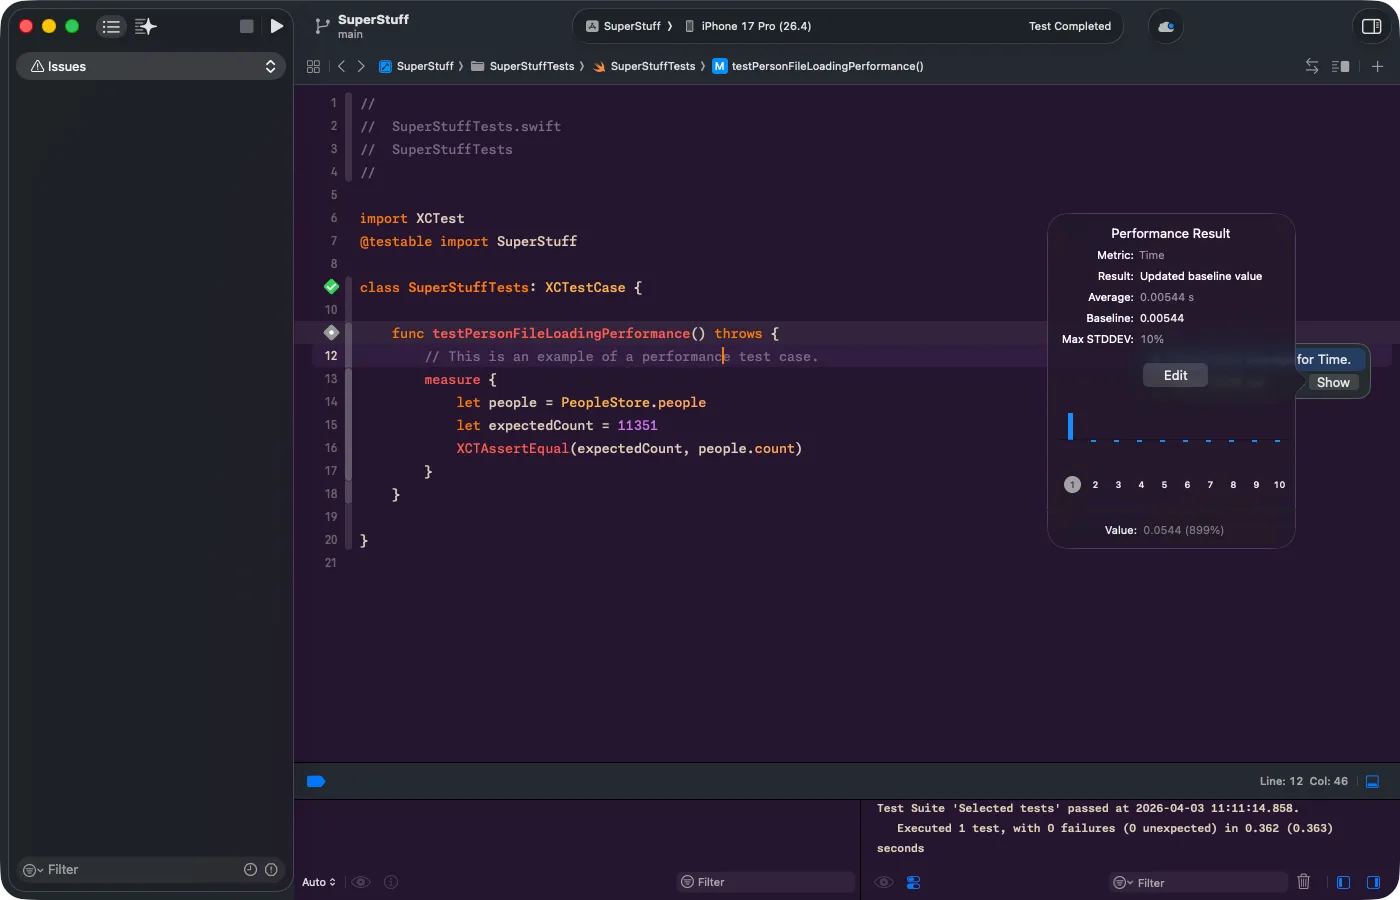
Click “Show” to open the full Performance Result popup. Here you see the average, the maximum standard deviation (Max STDDEV), the chart with all 10 iterations, and the “Set Baseline” button. Once you set the baseline, any future regression that exceeds the allowed deviation will cause the test to fail automatically.
3. Xcode Organizer: Real-World Metrics
The two tools above are for development. But what happens when the app is already in your users’ hands?
The Organizer window in Xcode (Window > Organizer) collects real metrics from your users’ devices — as long as they’ve opted to share diagnostics with Apple. Here you’ll see hang rates, scroll hitches, launch times, and battery usage, version after version.
The best part: you don’t need to integrate heavy third-party SDKs or configure MetricKit manually. Apple does it for you, for free, and presents it in comparative charts across versions of your app.
- Xcode Gauges → Immediate alarm signal during development (manual, ephemeral)
- XCTest measure → CI/CD automation with baselines and regression detection
- Xcode Organizer → Real user metrics in production, version after version
Connecting the Dots
We covered a lot of ground today. Stack and Heap, the internal structure of a Mach-O binary, how the system translates addresses to function names, and three Xcode tools that let you detect problems without needing Instruments.
Each of these pieces connects to the next. Understanding Stack vs. Heap lets you interpret an Allocation trace. Understanding Mach-O lets you read VM Tracker. Understanding symbolication saves you hours staring at meaningless hexadecimal addresses. And using the early detection tools transforms you from a firefighter into an architect.
Optimizing isn’t about fixing slow code. It’s about understanding where and how your code interacts with the system — and getting ahead of it.
In the first part of this series we learned to use Instruments as a tool. Today we learned the patient’s anatomy. But there’s a missing piece: we mentioned malloc, free, refCount — concepts that sound abstract if you’ve never worked at that level. In the next article we’ll close that gap with interactive visualizations that let you see how memory works step by step.
References
- Symbolication: Beyond the Basics — WWDC21 — Apple session explaining the symbolication process, ASLR, UUIDs, DWARF, and tools like
atosin depth. - OS X ABI Mach-O File Format Reference — Complete reference of the Mach-O format structure: headers, load commands, segments, sections, symbol tables, and lazy binding.
- Recording Performance Data — Apple Documentation — Official documentation for
OSSignposterand how to instrument your code with signposts. - Improving App Responsiveness — Apple Documentation — Apple’s guide on hangs, hitches, and best practices for keeping the main thread free.
Related
-
- swift
- swift-zero-expert
- swift-fundamentals
Swift from Zero to Expert #14: Generics
One swapTwoValues, one Stack<Element>, one findIndex — written once, working for every type. Generics let the caller pick the concrete type, the compiler specialize the code, and the box from #13 disappear. Array, Dictionary, Optional, and Result were generic all along.
-
- swift
- swift-zero-expert
- swift-fundamentals
Swift from Zero to Expert #13: Protocols
A protocol is a contract, not a class. It says what a type must do without saying what it is — and that single idea powers delegation, synthesized Equatable, existentials, and the protocol extensions that make Swift idiomatic.
-
- swift
- swift-zero-expert
- swift-fundamentals
Swift from Zero to Expert #12: Error Handling
throw, try, do/catch, defer, rethrows, Result, and Swift 6 typed throws. An error isn't a magic exception — it's just a value of a type that conforms to Error, routed through your call stack as cheaply as a return.